Tekton Pipeline Exploration
As a developer, I can see all the steps involved with the corporate standard pipeline and GREEN is good. As a developer, that makes me happy, I do not have worry about all the details.
Narrator: Now, for our architects and platform engineers in the room, you want to pull back the curtains and see how this magic works, your customer, the app developer is happy with a green pipeline and the simplicity of "git commit and git push" but your DevOps engineers would like to dig deeper into how this better secures the software supply chain. Before go behind the scenes let’s first explore the rest of the developer user experience.
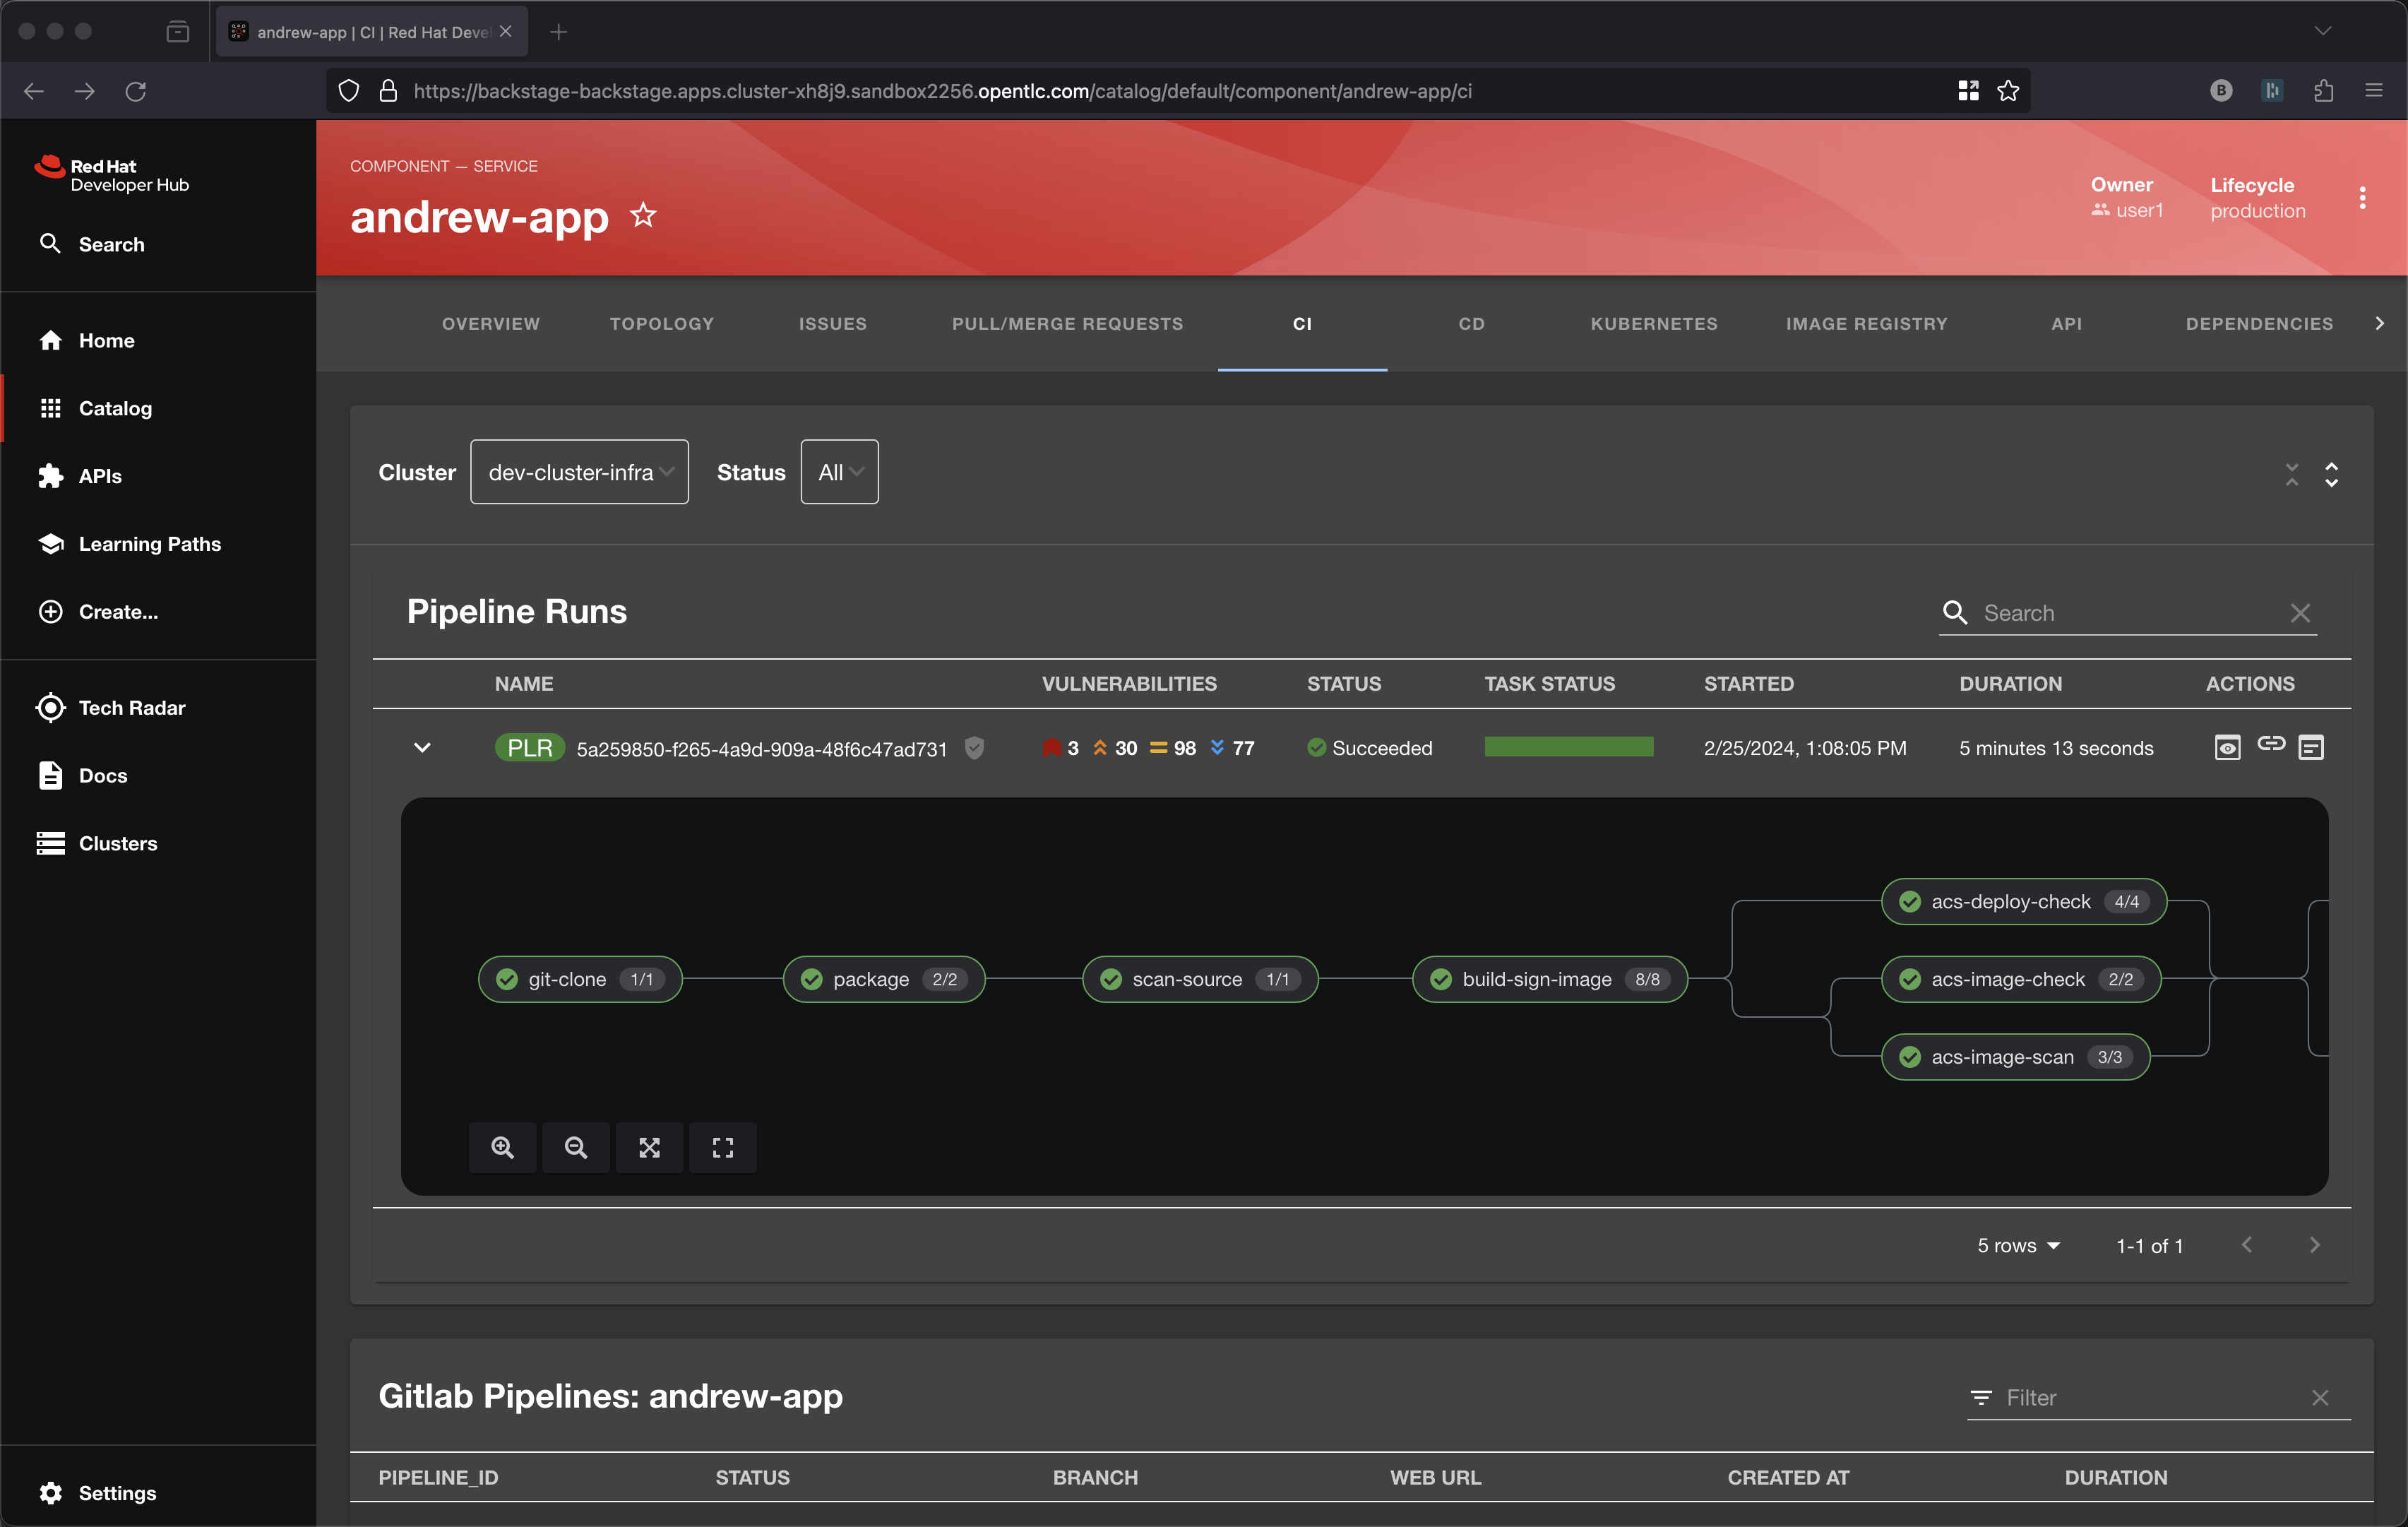
Developer Hub pre-integrates several curated plug-ins that are great for overall developer experience. A lot has happened with the execution of this pipeline.
The first step in the pipeline is a simple git clone. The next step is basically a mvn package and then running of Sonarqube scan-source for static analysis. All pretty standard for CI pipelines. Get the code, compile/build the code, run some scans.
Build Sign Image
It is the build-sign-image where things get super interesting.
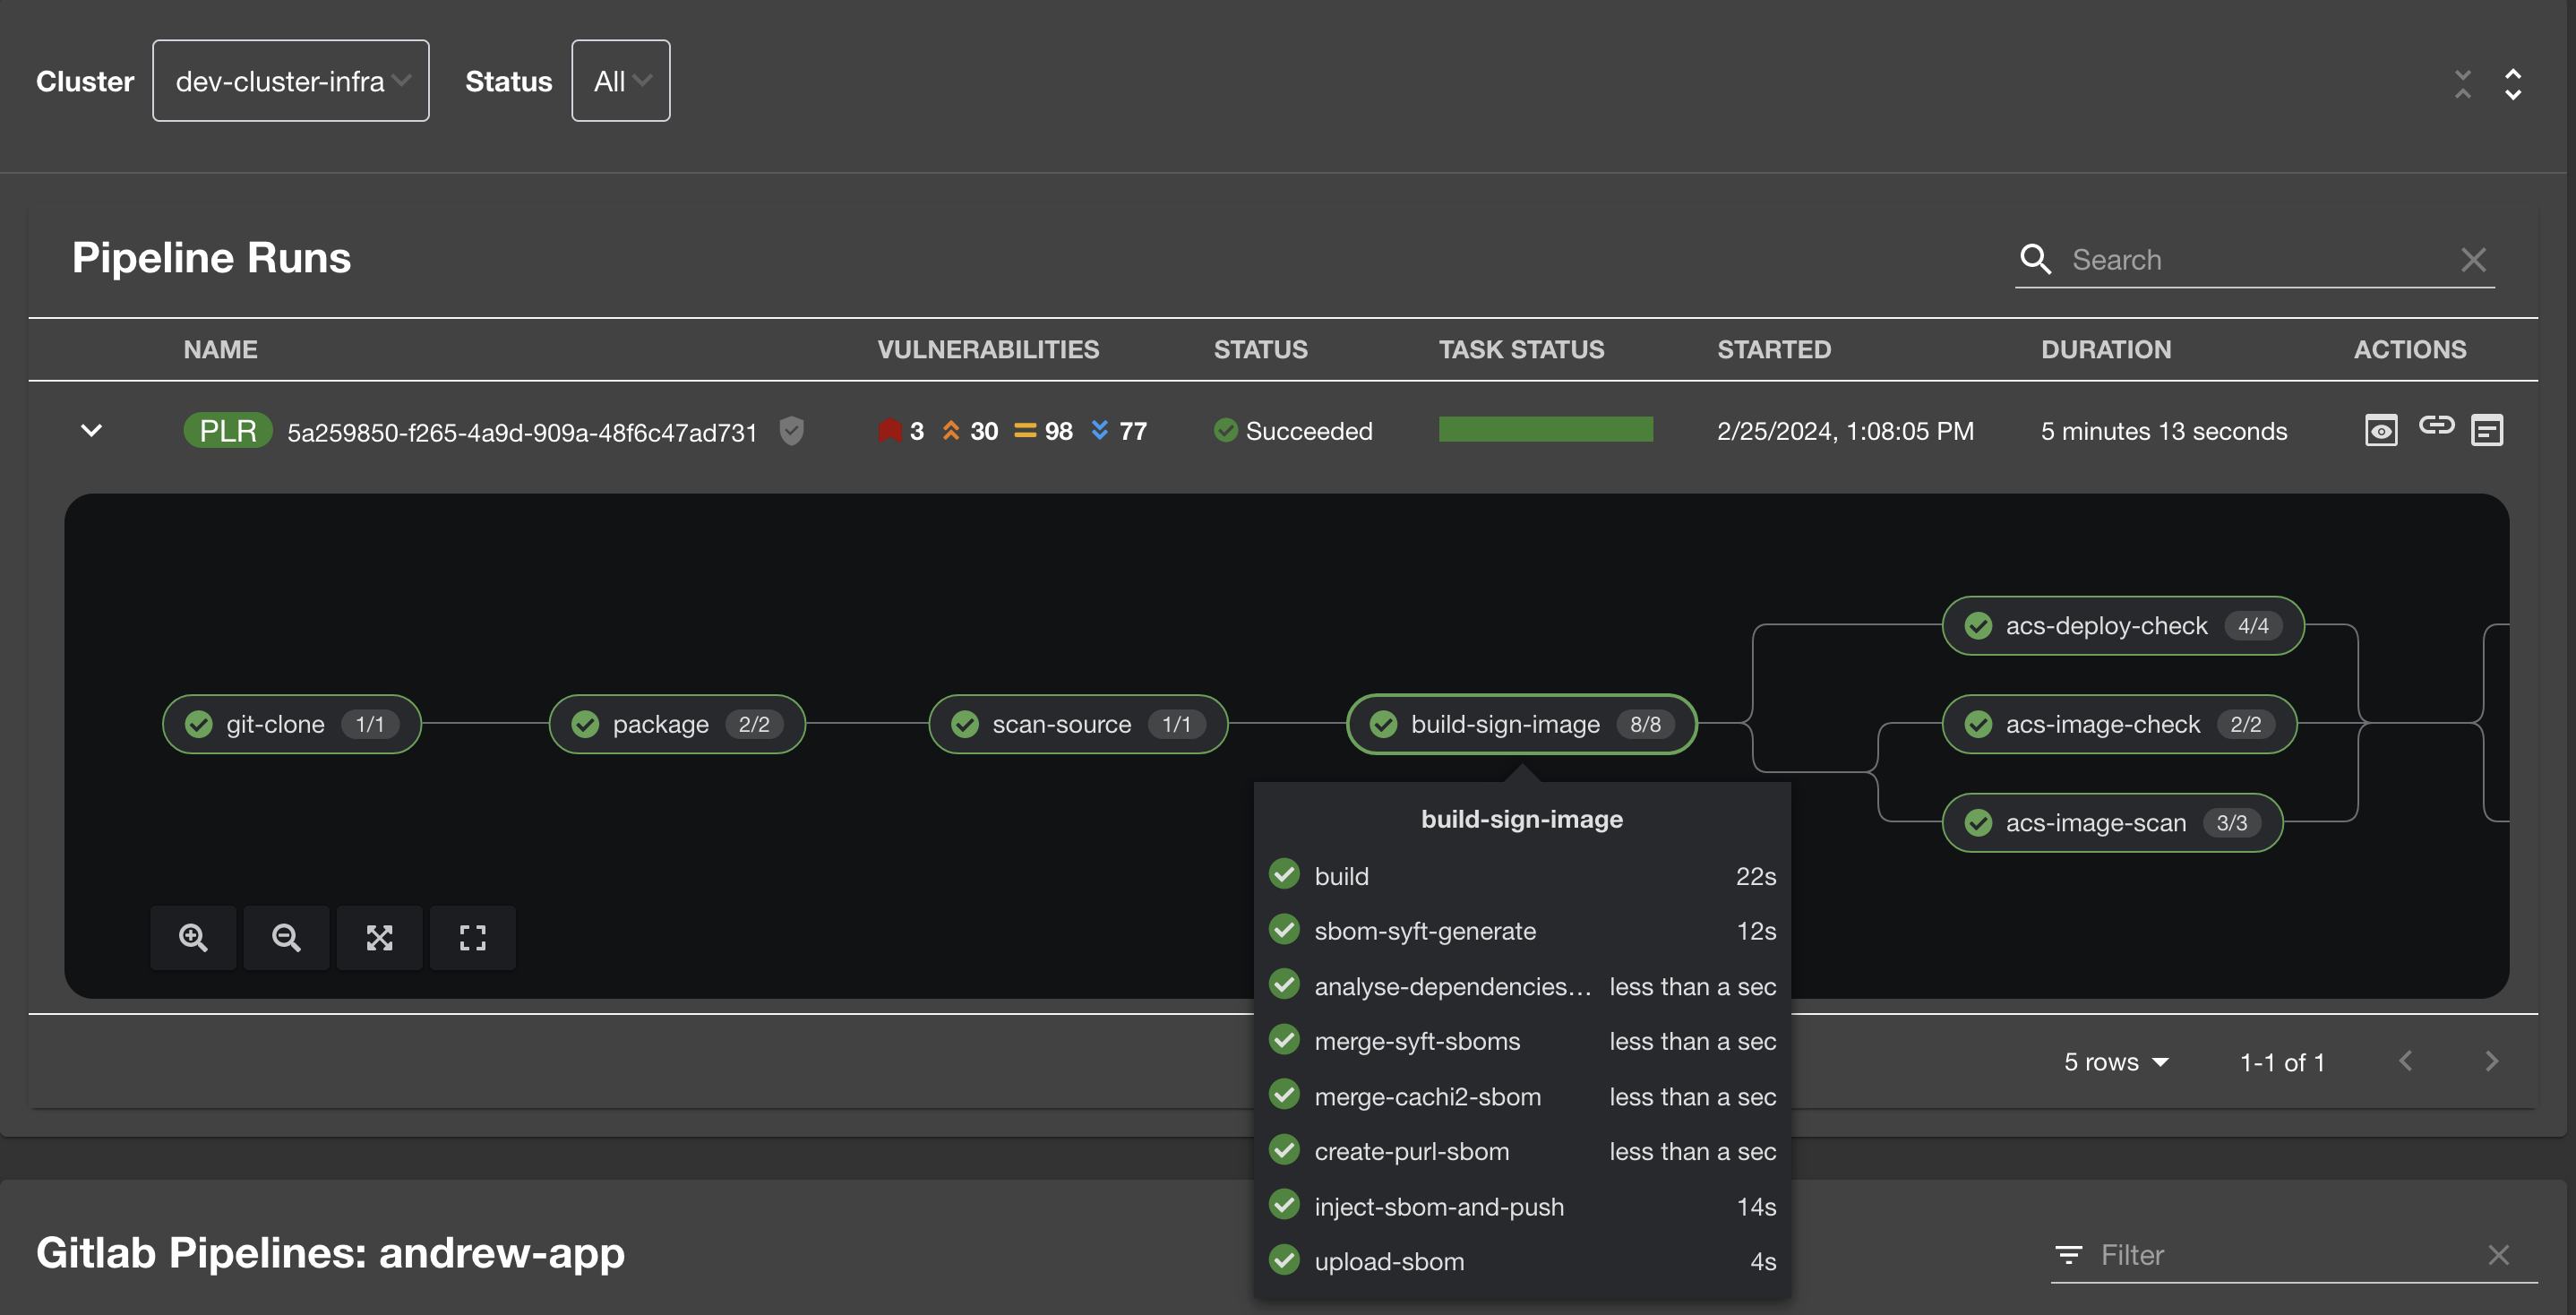
The template is leveraging Tekton Chains, a Kubernetes Custom Resource Definition (CRD) controller, that nicely augments the supply chain security within OpenShift Pipelines. This tool’s capacity to automatically sign task runs, and its adoption of advanced attestation formats like in-toto and SLA provenance, bring a higher degree of trust and verification to our processes. Tekton Chains works like an independent observer within the cluster, it signs, attests and stores additional artifacts as OCI images alongside with your container image.
If you look on the Image Registry tab you will see there is are .att, .sig and .sbom sitting side-by-side with the resulting container image produced by the pipeline.
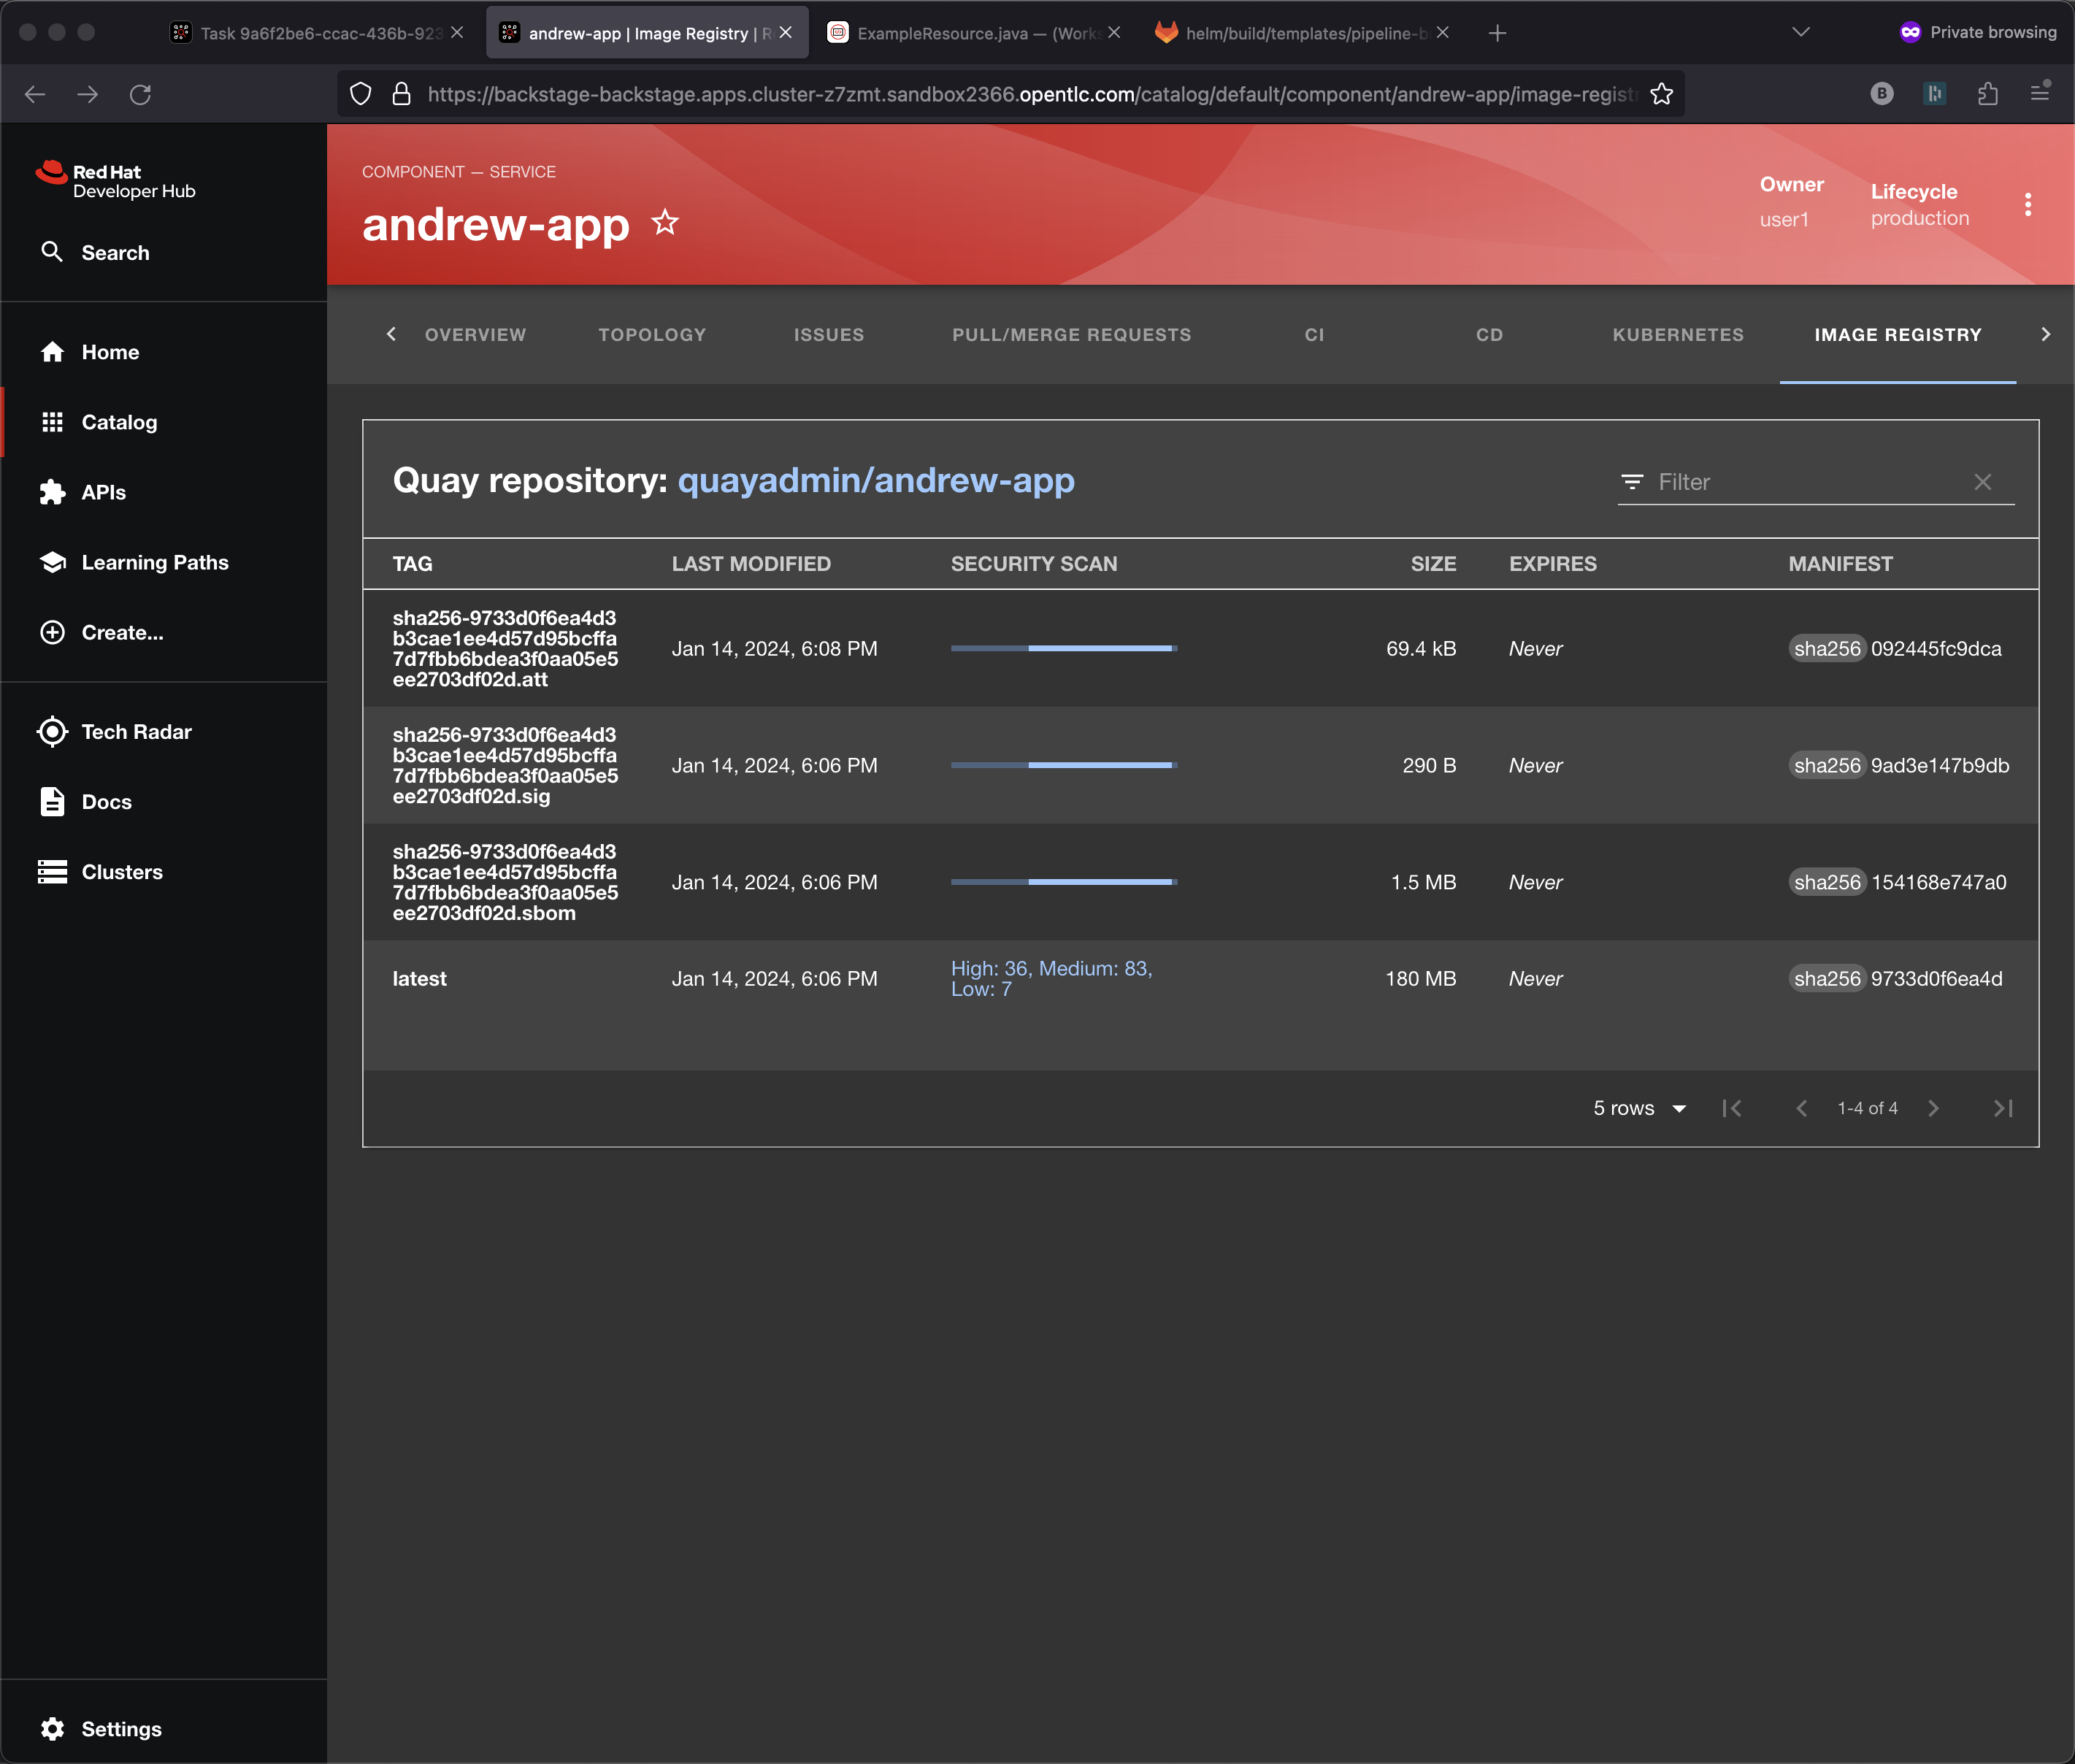
This plug-in using Quay, you might remember we selected Quay in the template wizard. Quay offers yet another aspect of supply chain security, it is constantly scanning your container images at rest. Your developers might not be actively coding and if nobody has pushed a change recently then the pipeline might not have run in a while.
roxctl (ACS)
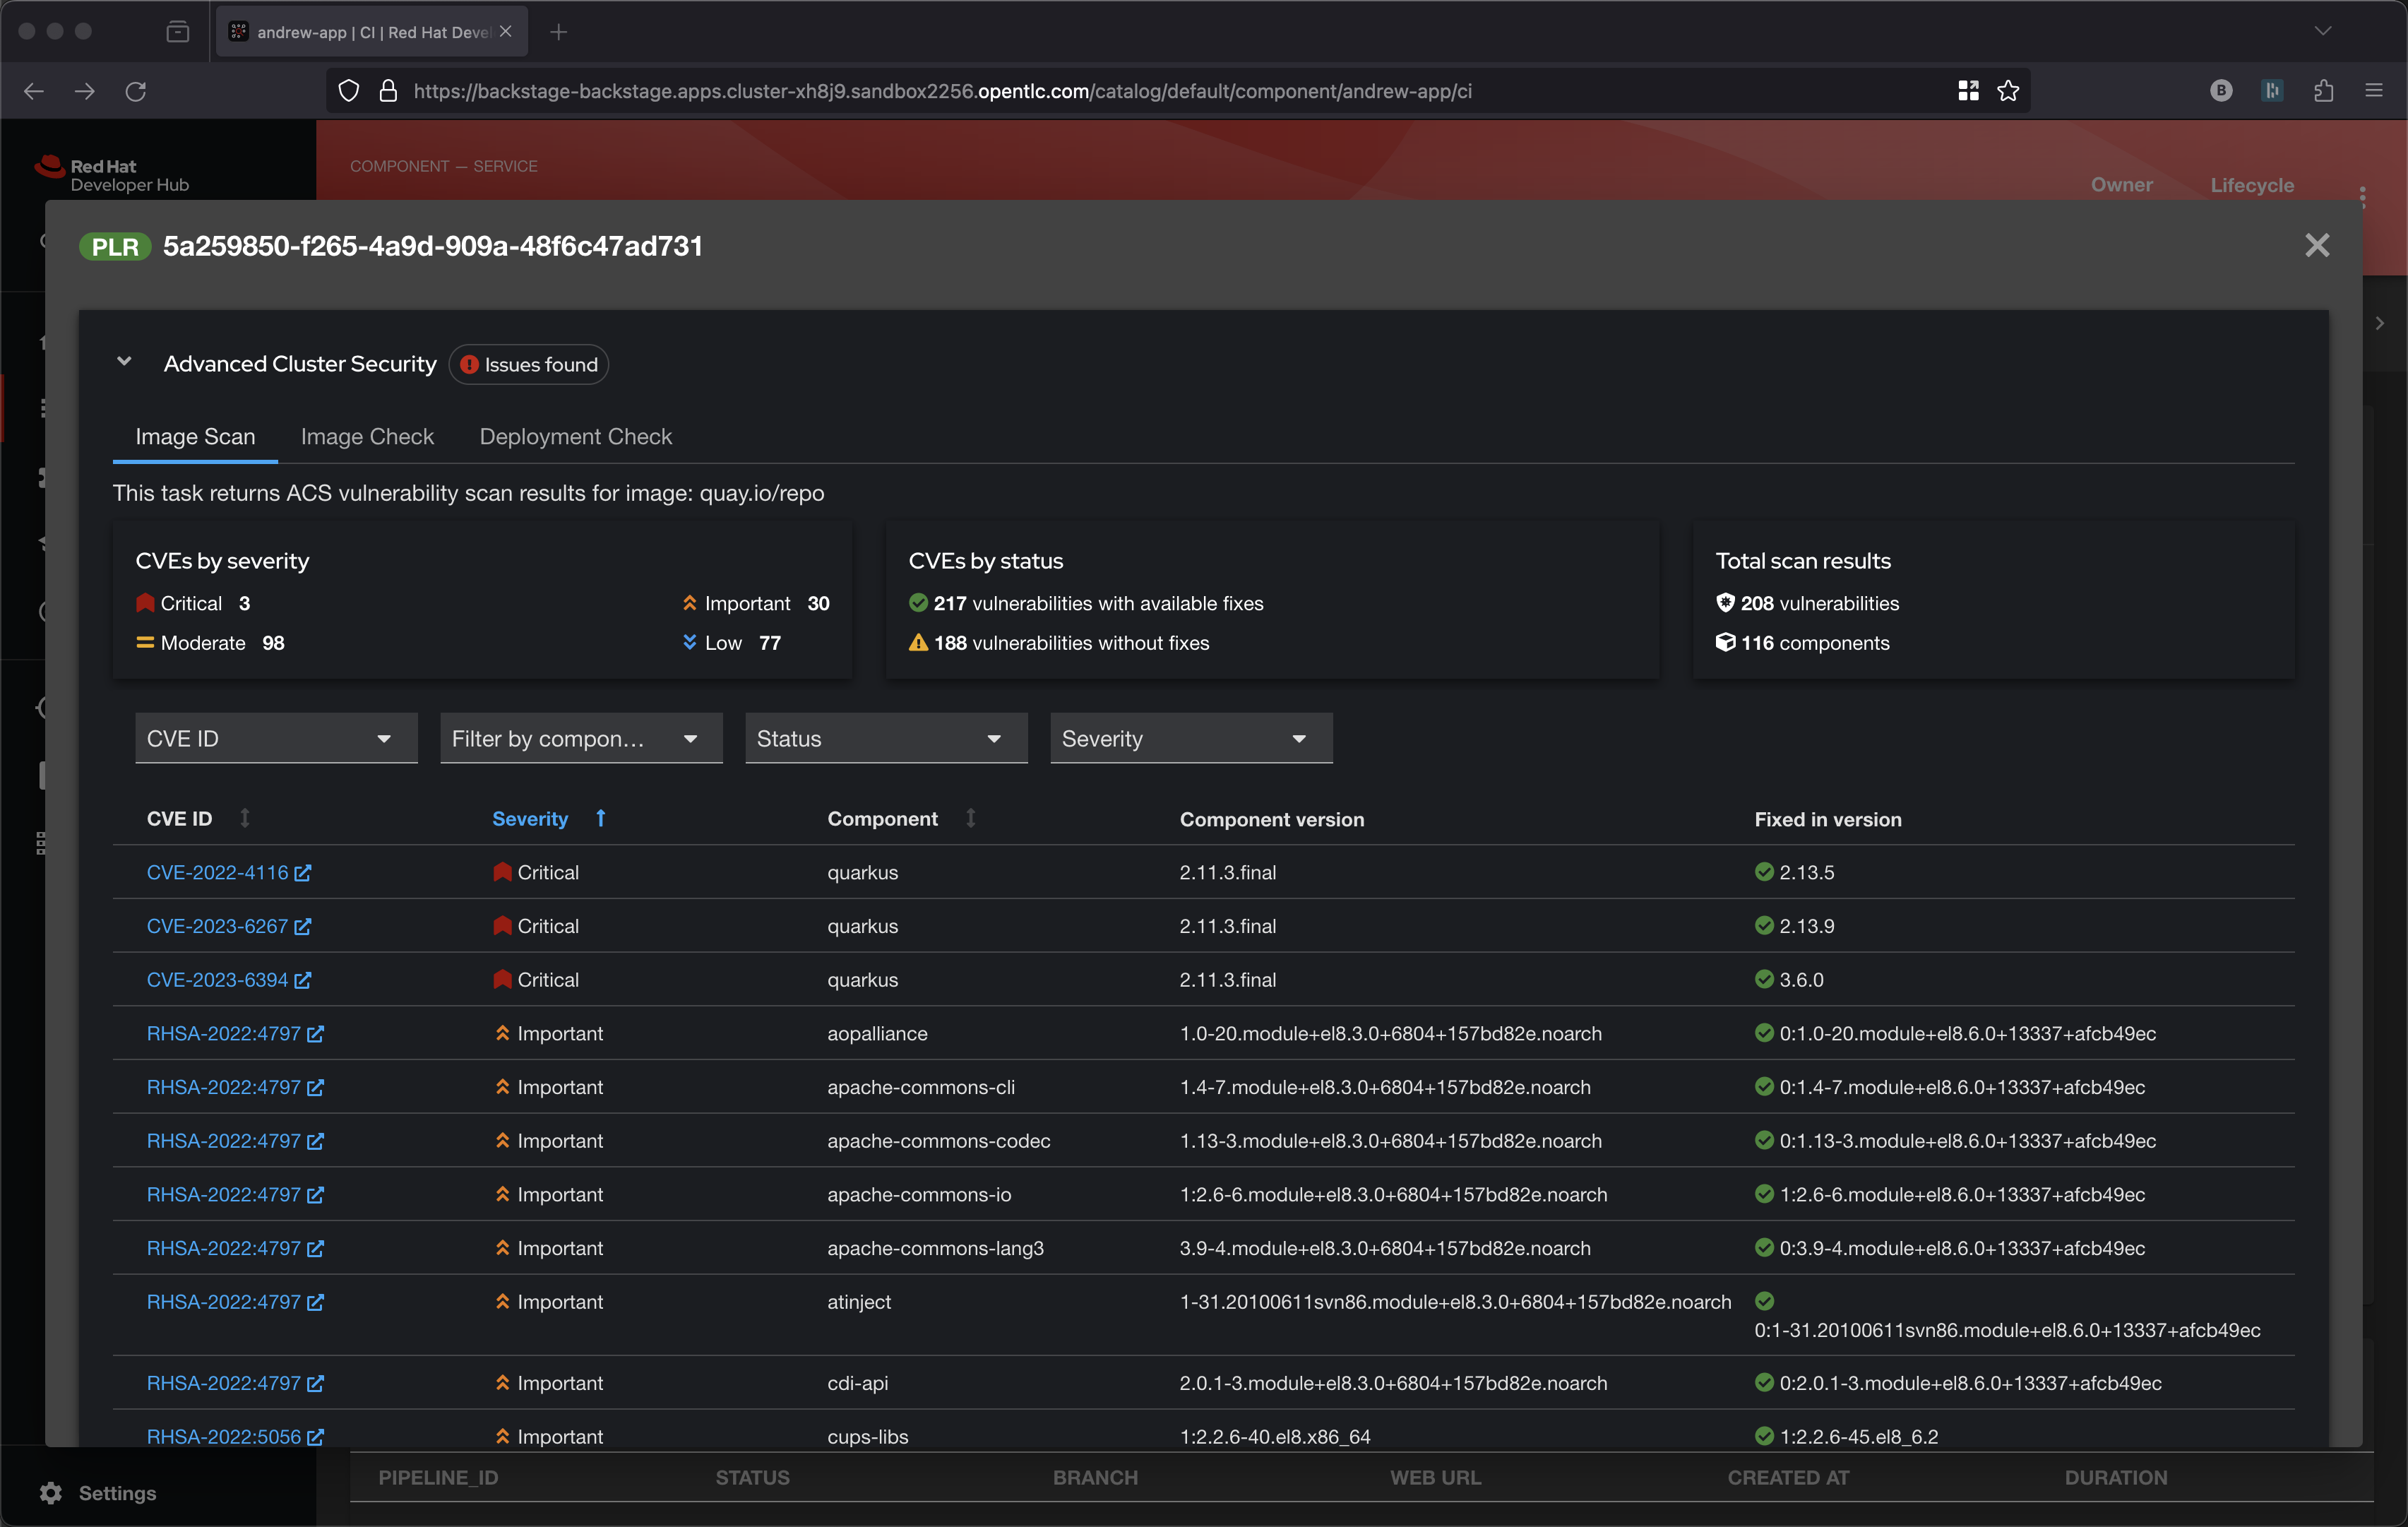
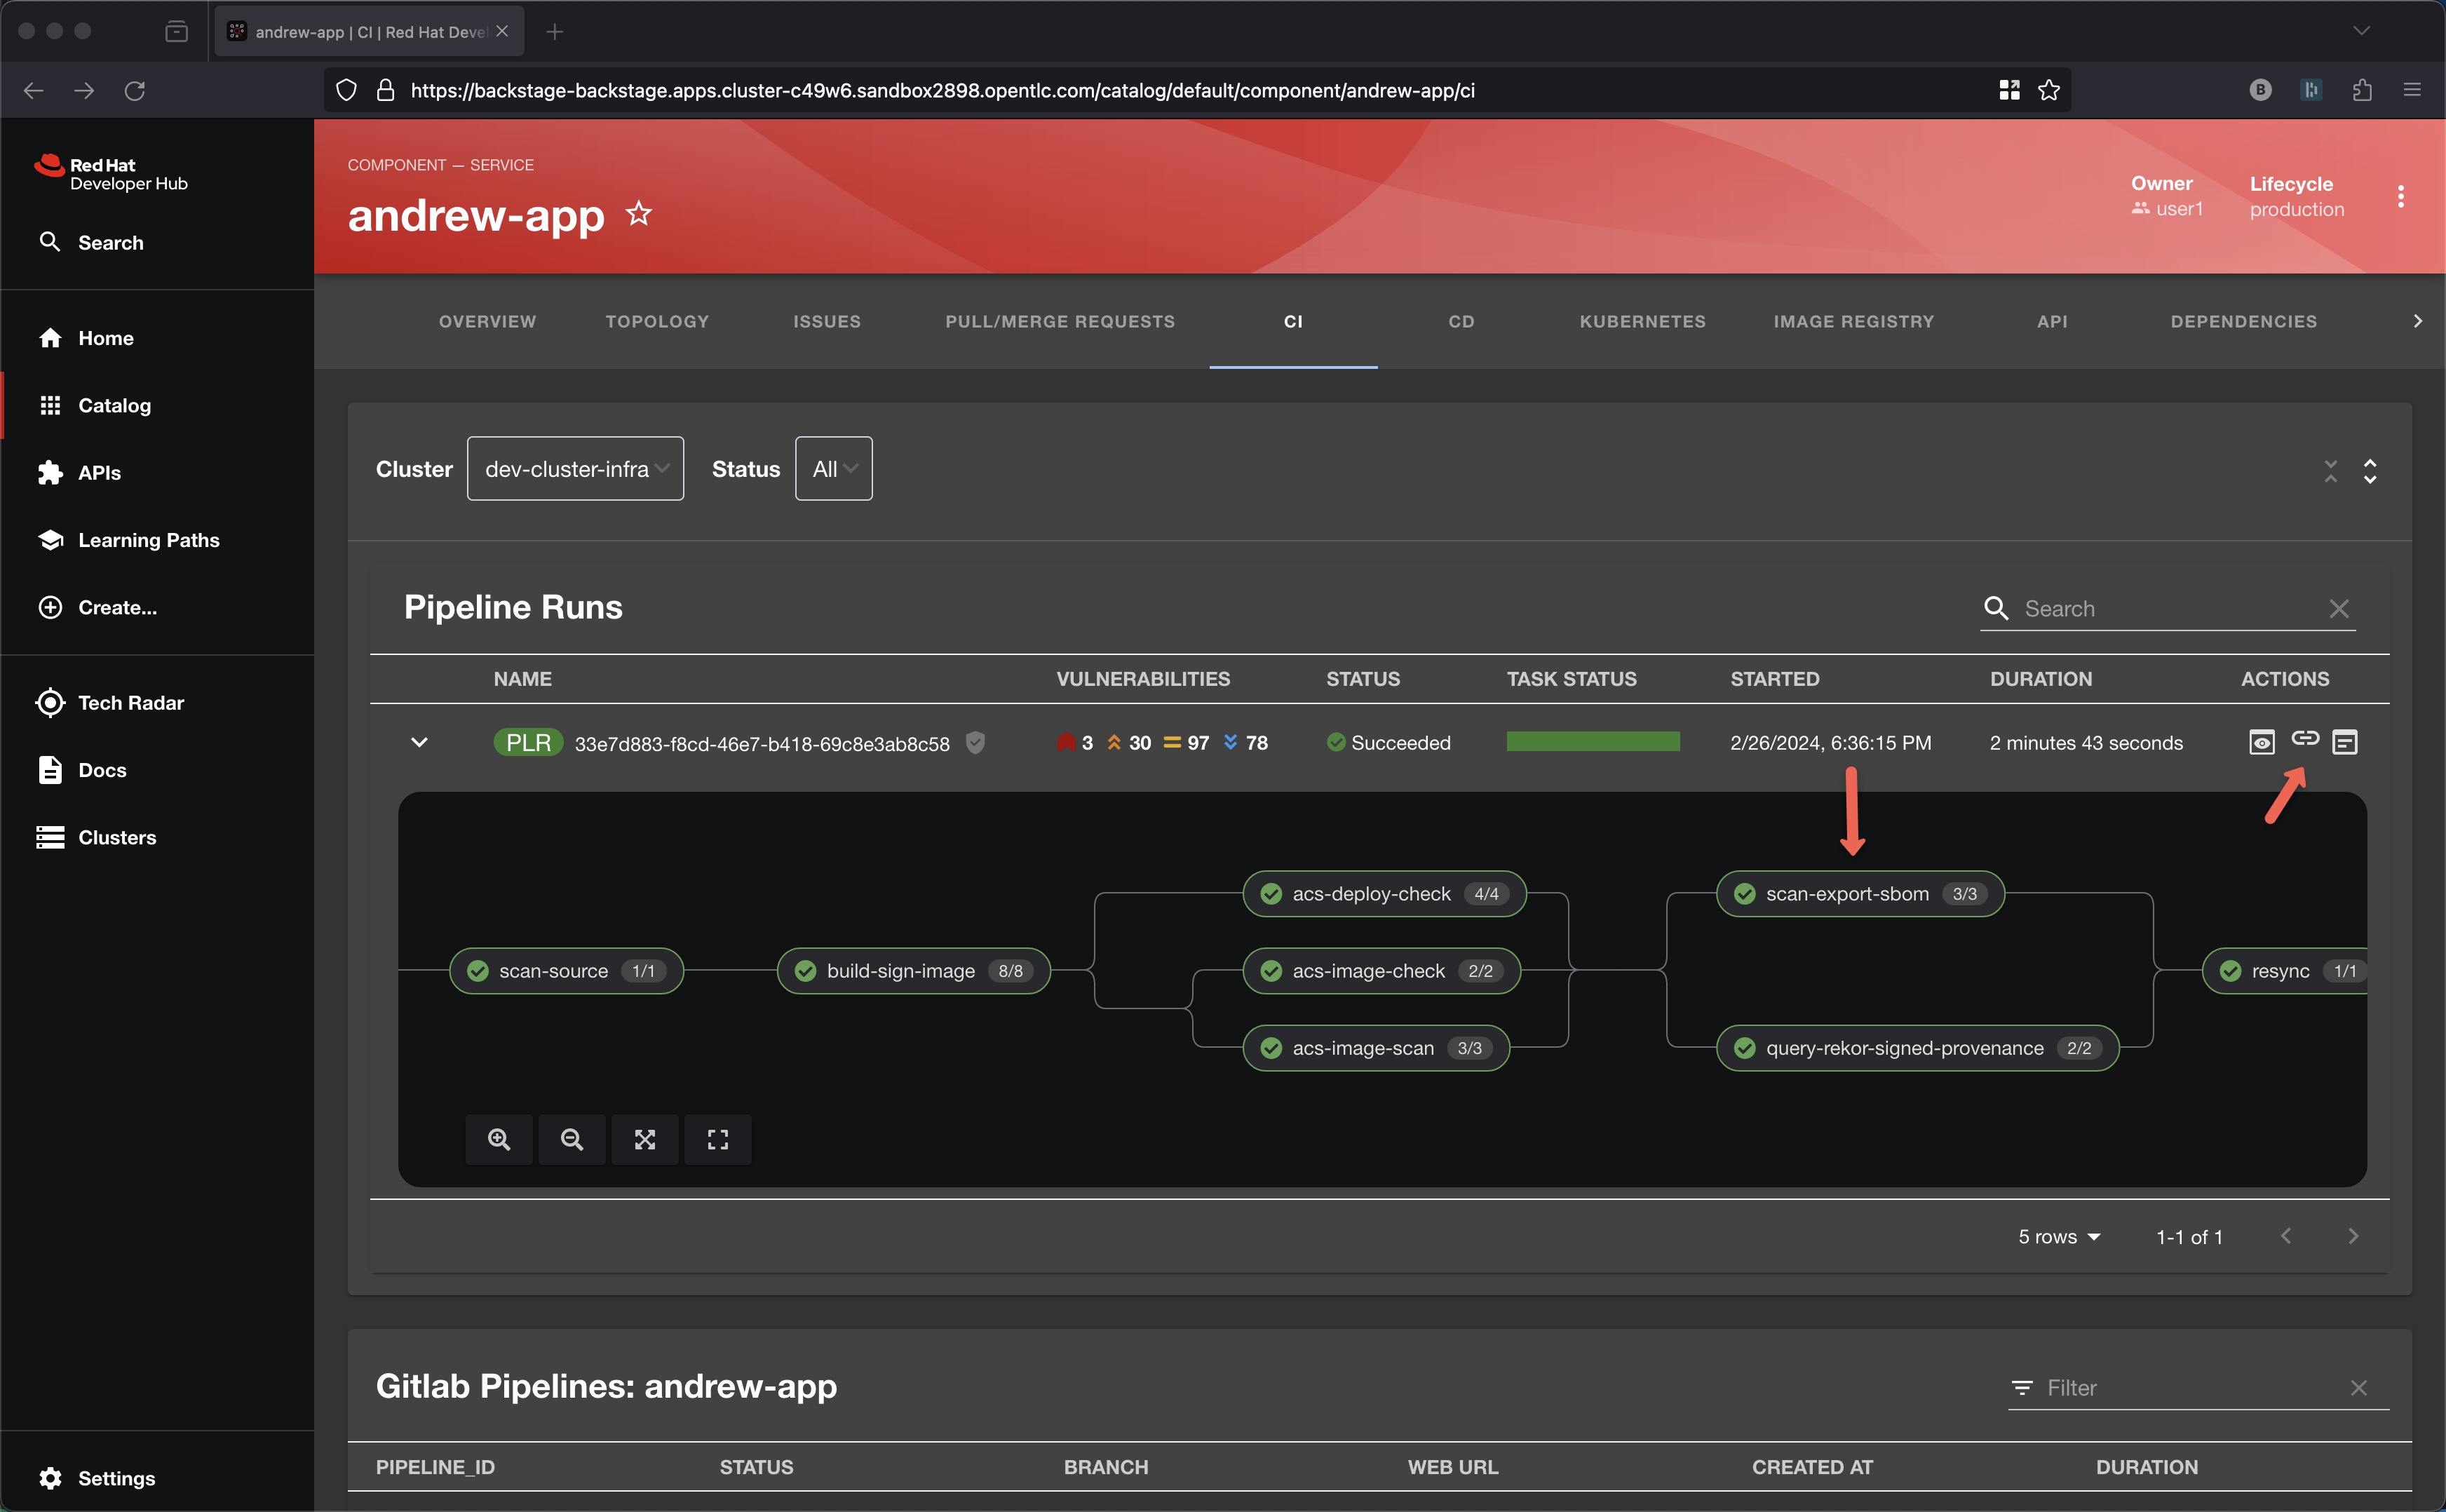
Back to the pipeline itself and let’s look at the 3 Advanced Cluster Security tasks leveraging roxctl
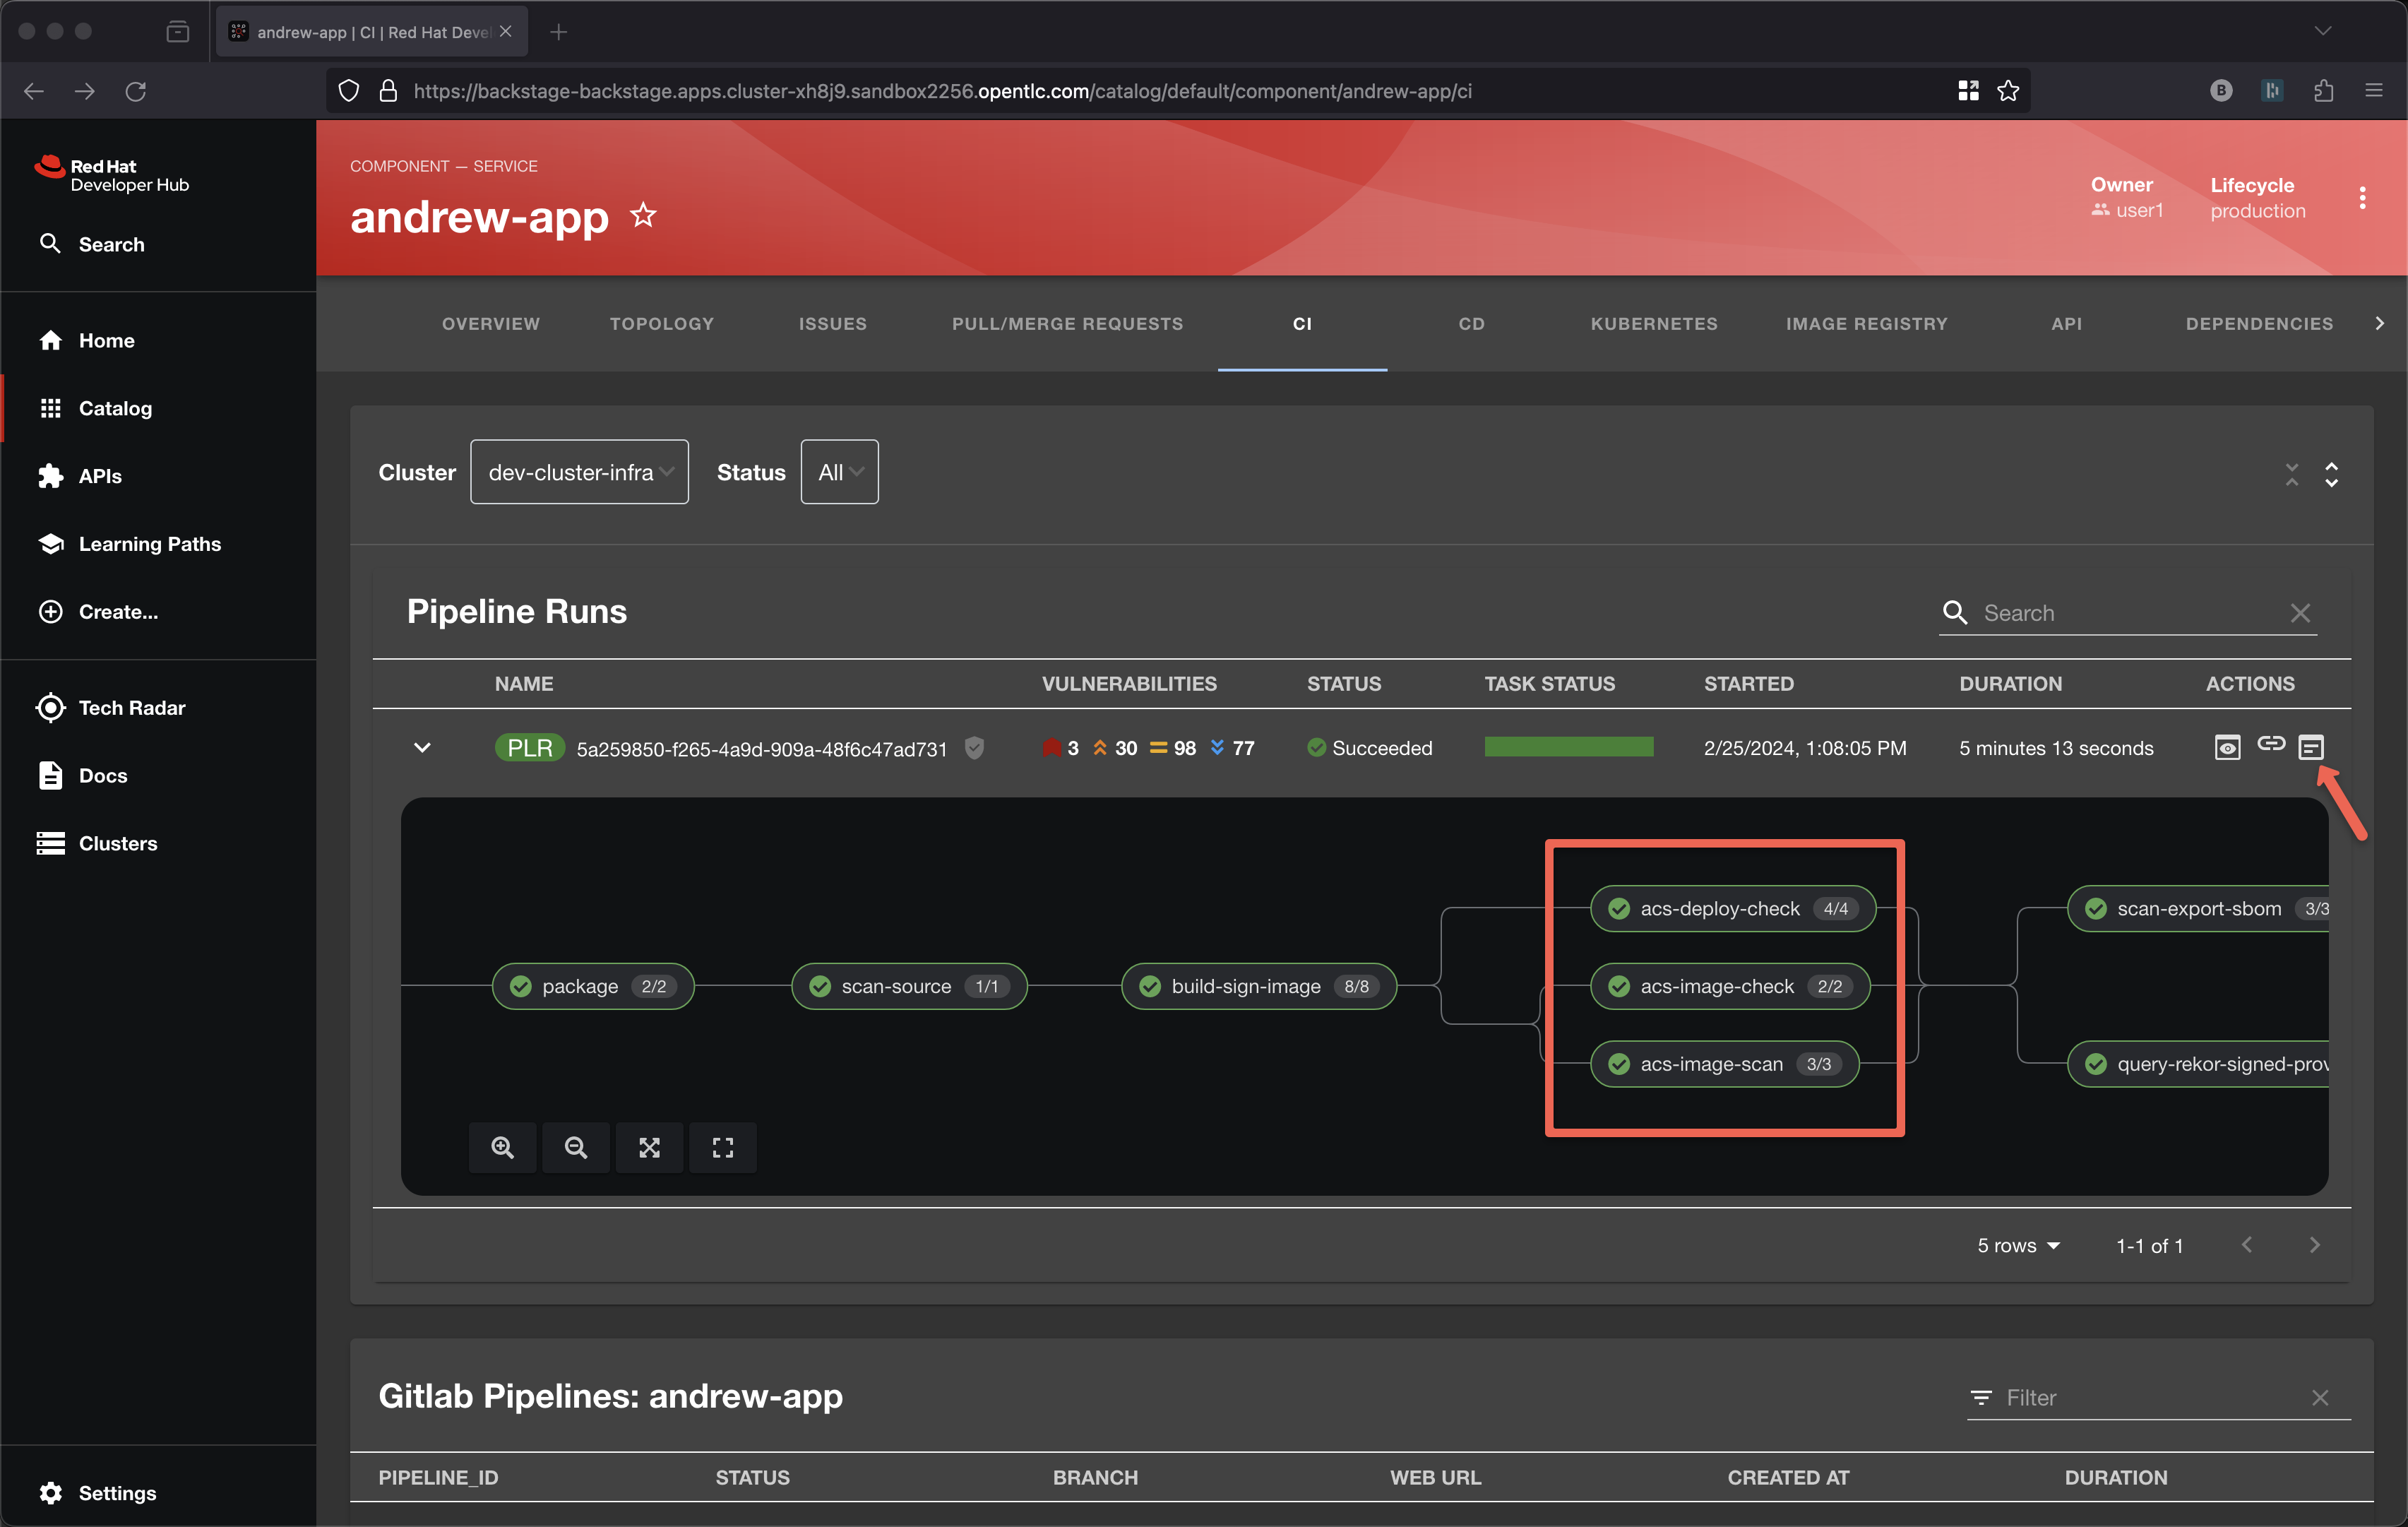
The bottom-most task is performing CVE scanning via roxctl image scan.
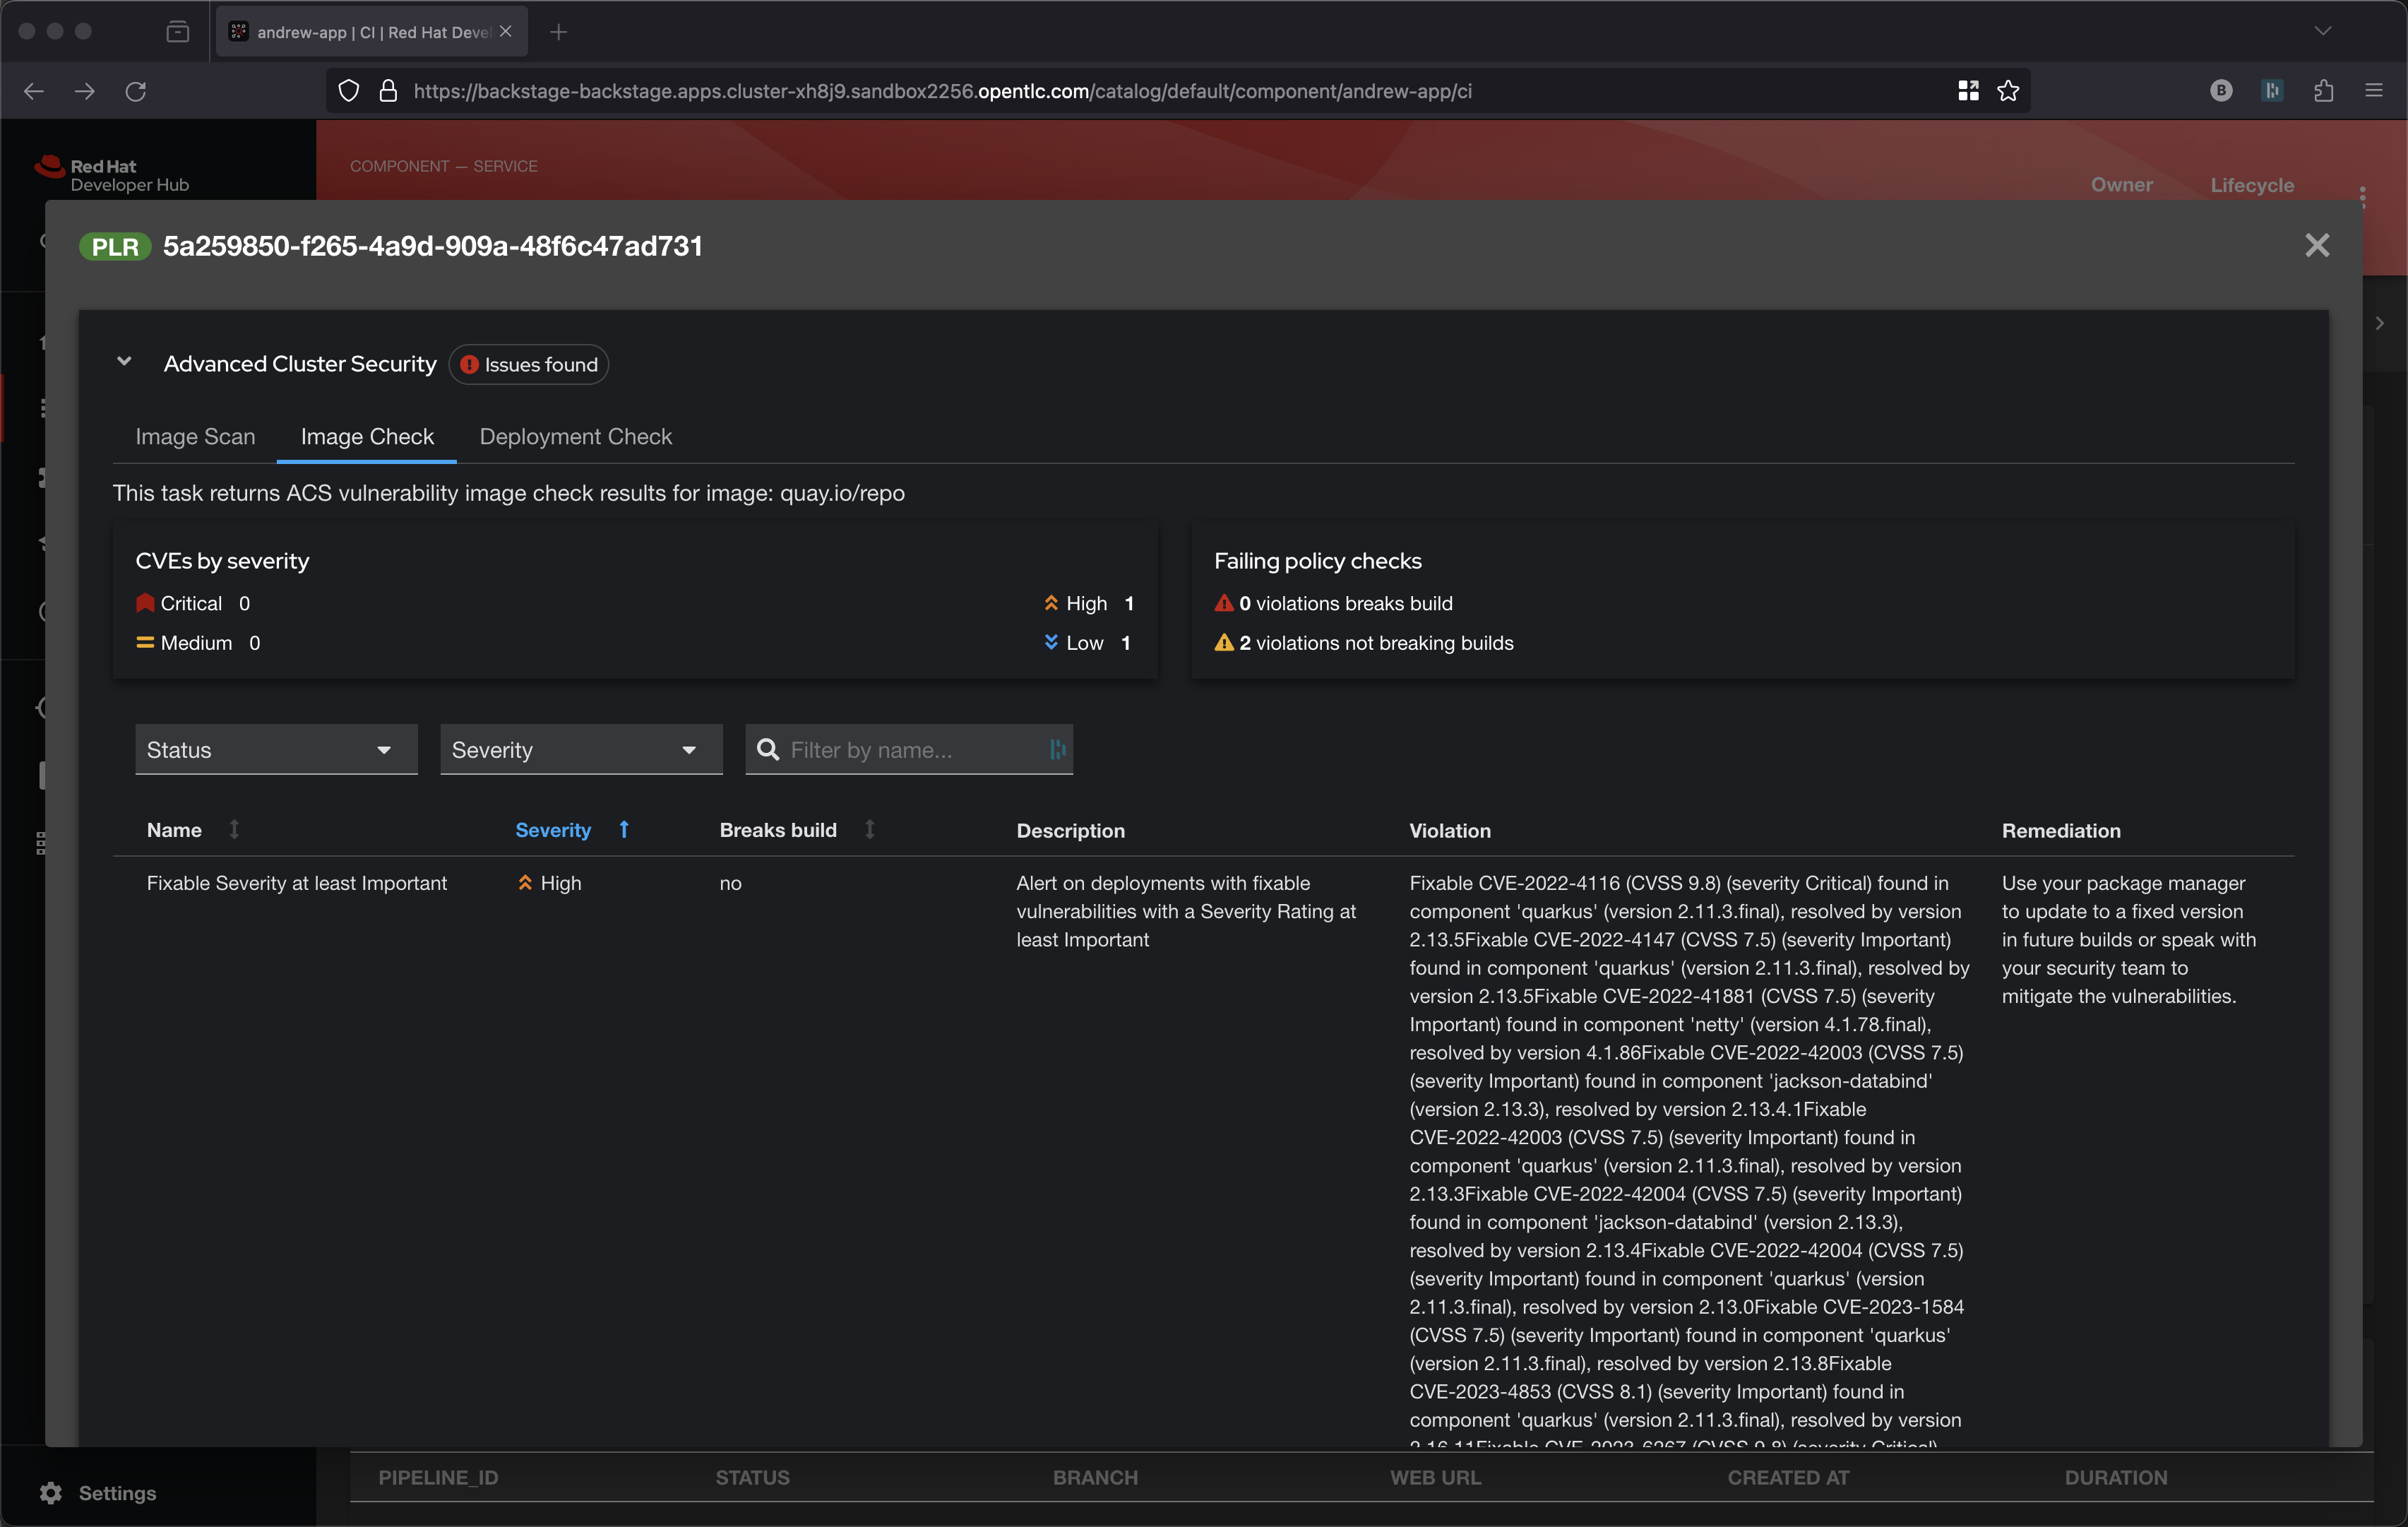
The middle task is performing a policy check via roxctl image check. These policies might be things like 'No log4j allowed' or perhaps no curl, wget nor a package manager in a production image.
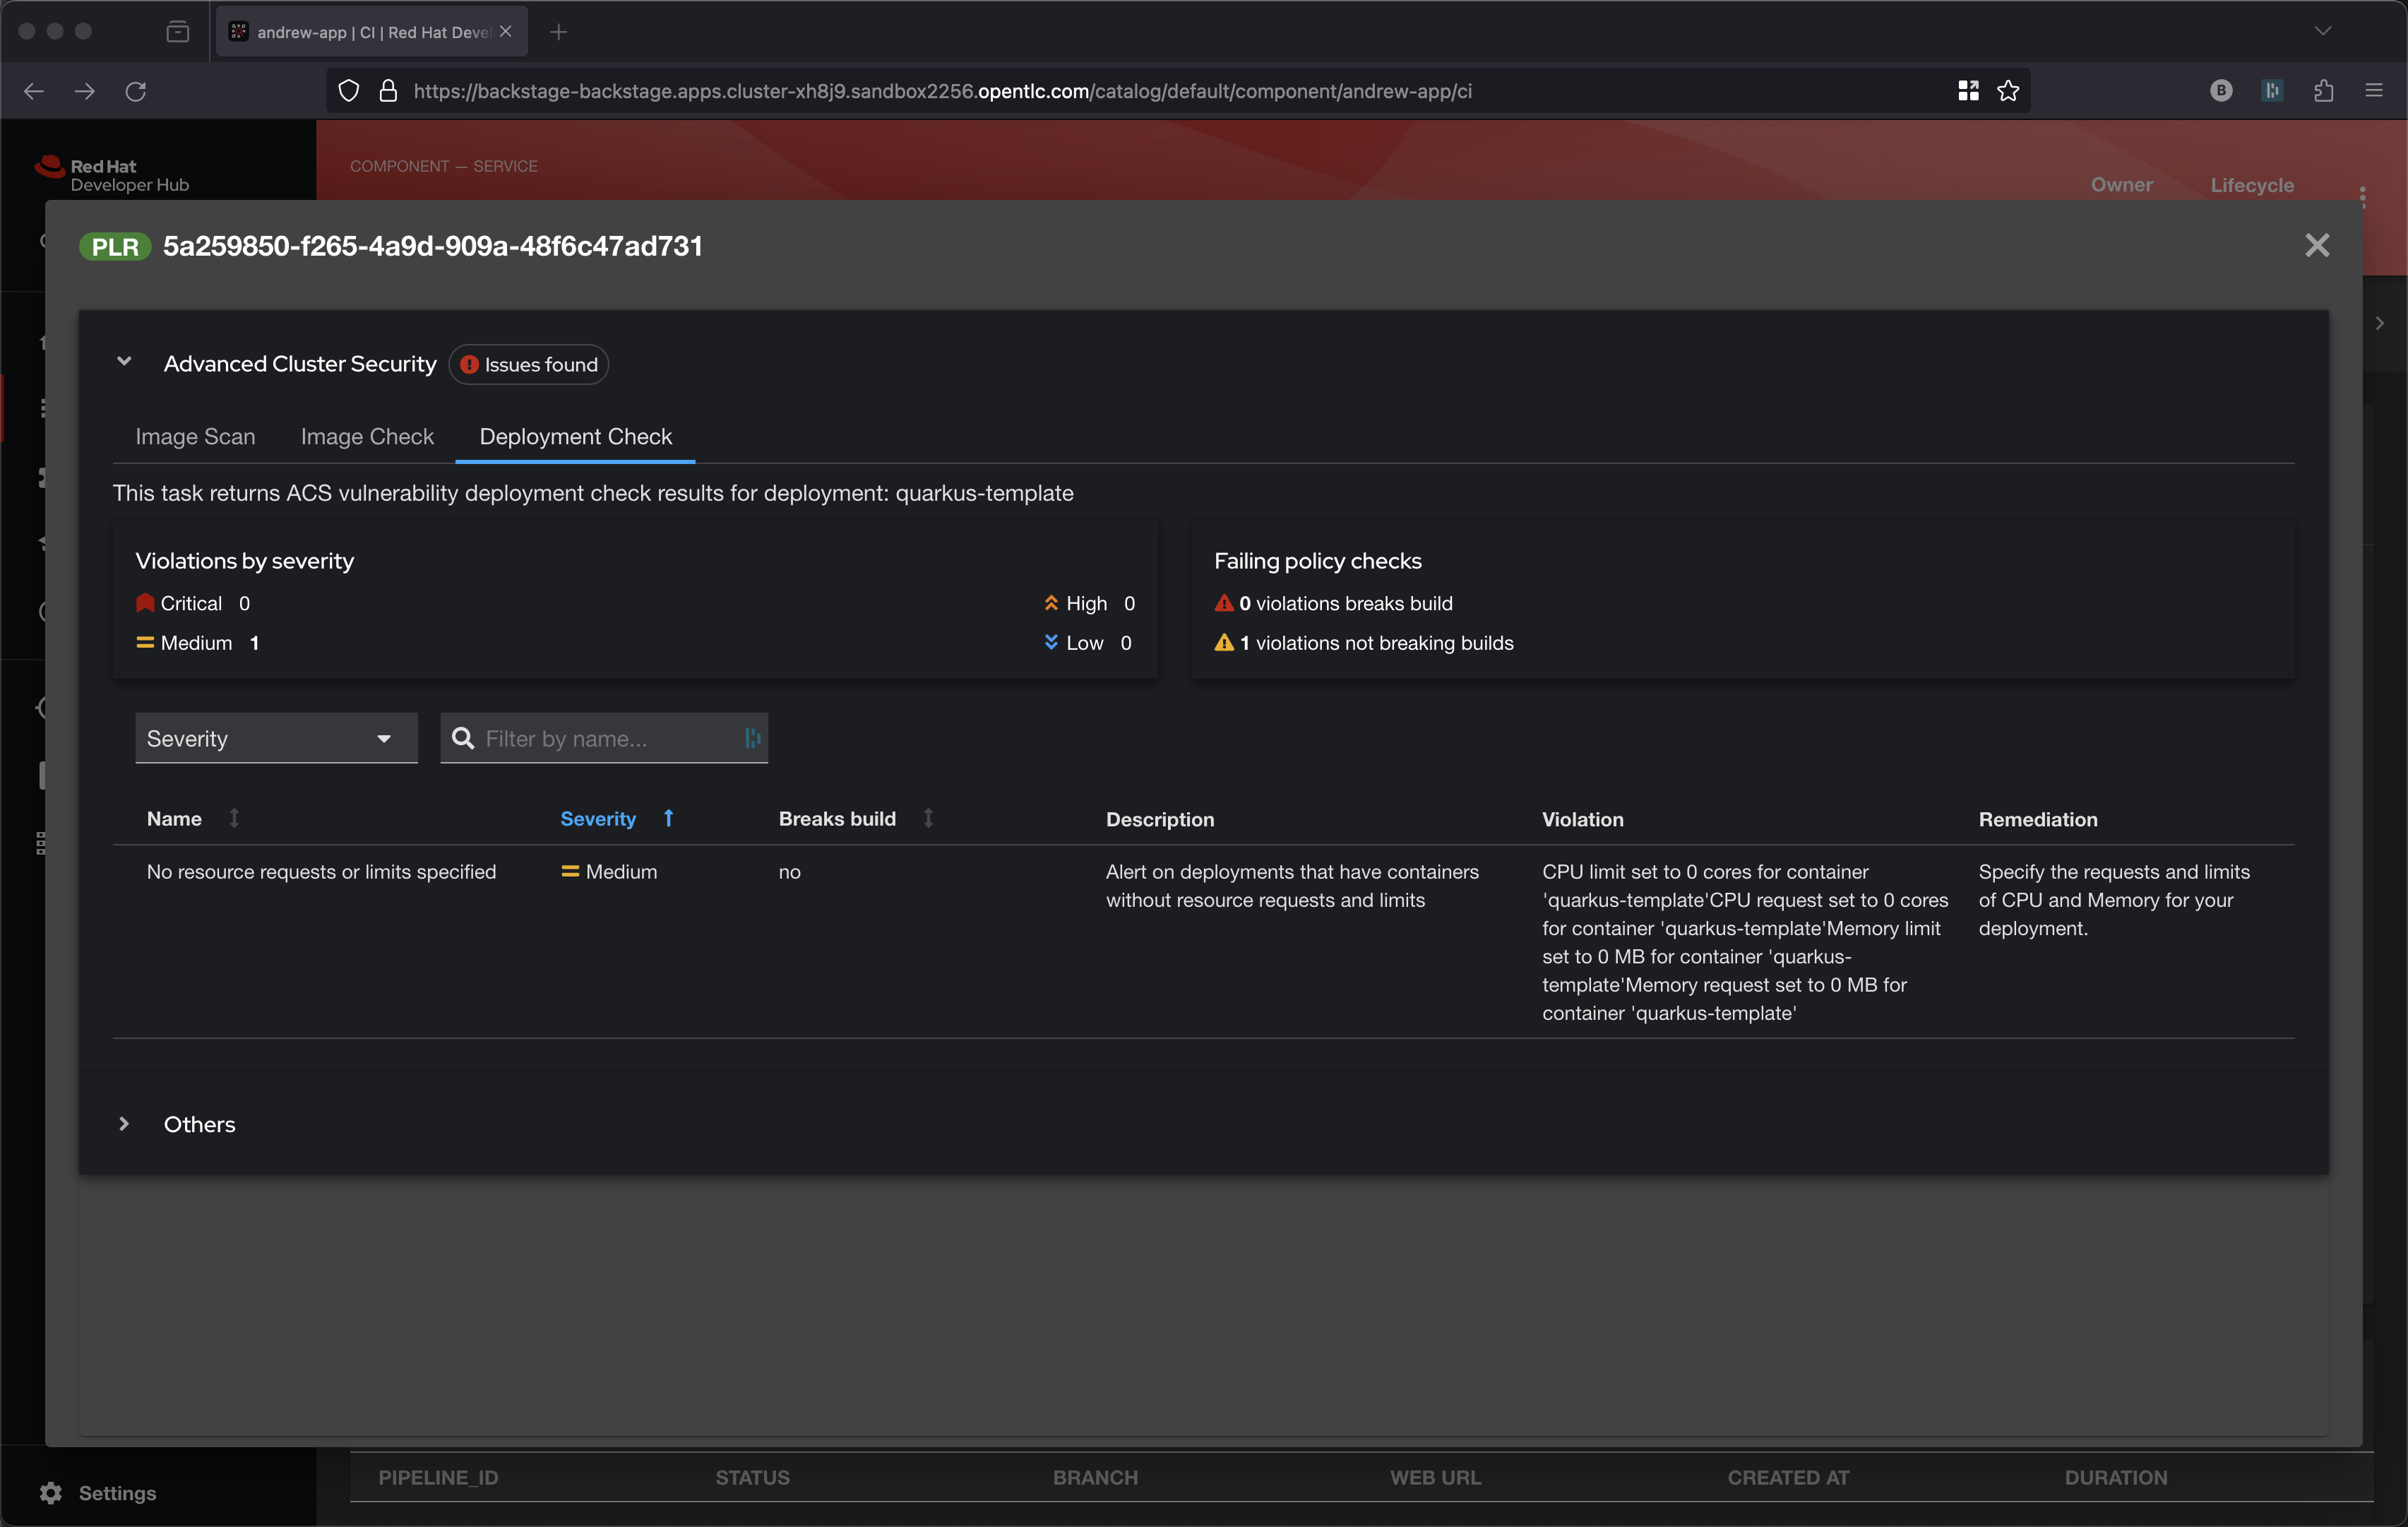
The top-most task is perform yaml scanning via roxctl deployment check and it might identify that your Deployment.yaml has not properly configured its resource request and limit.
A series of dashboards visualize the reporting from these 3 roxctl tasks, click on the View Output icon under ACTIONS
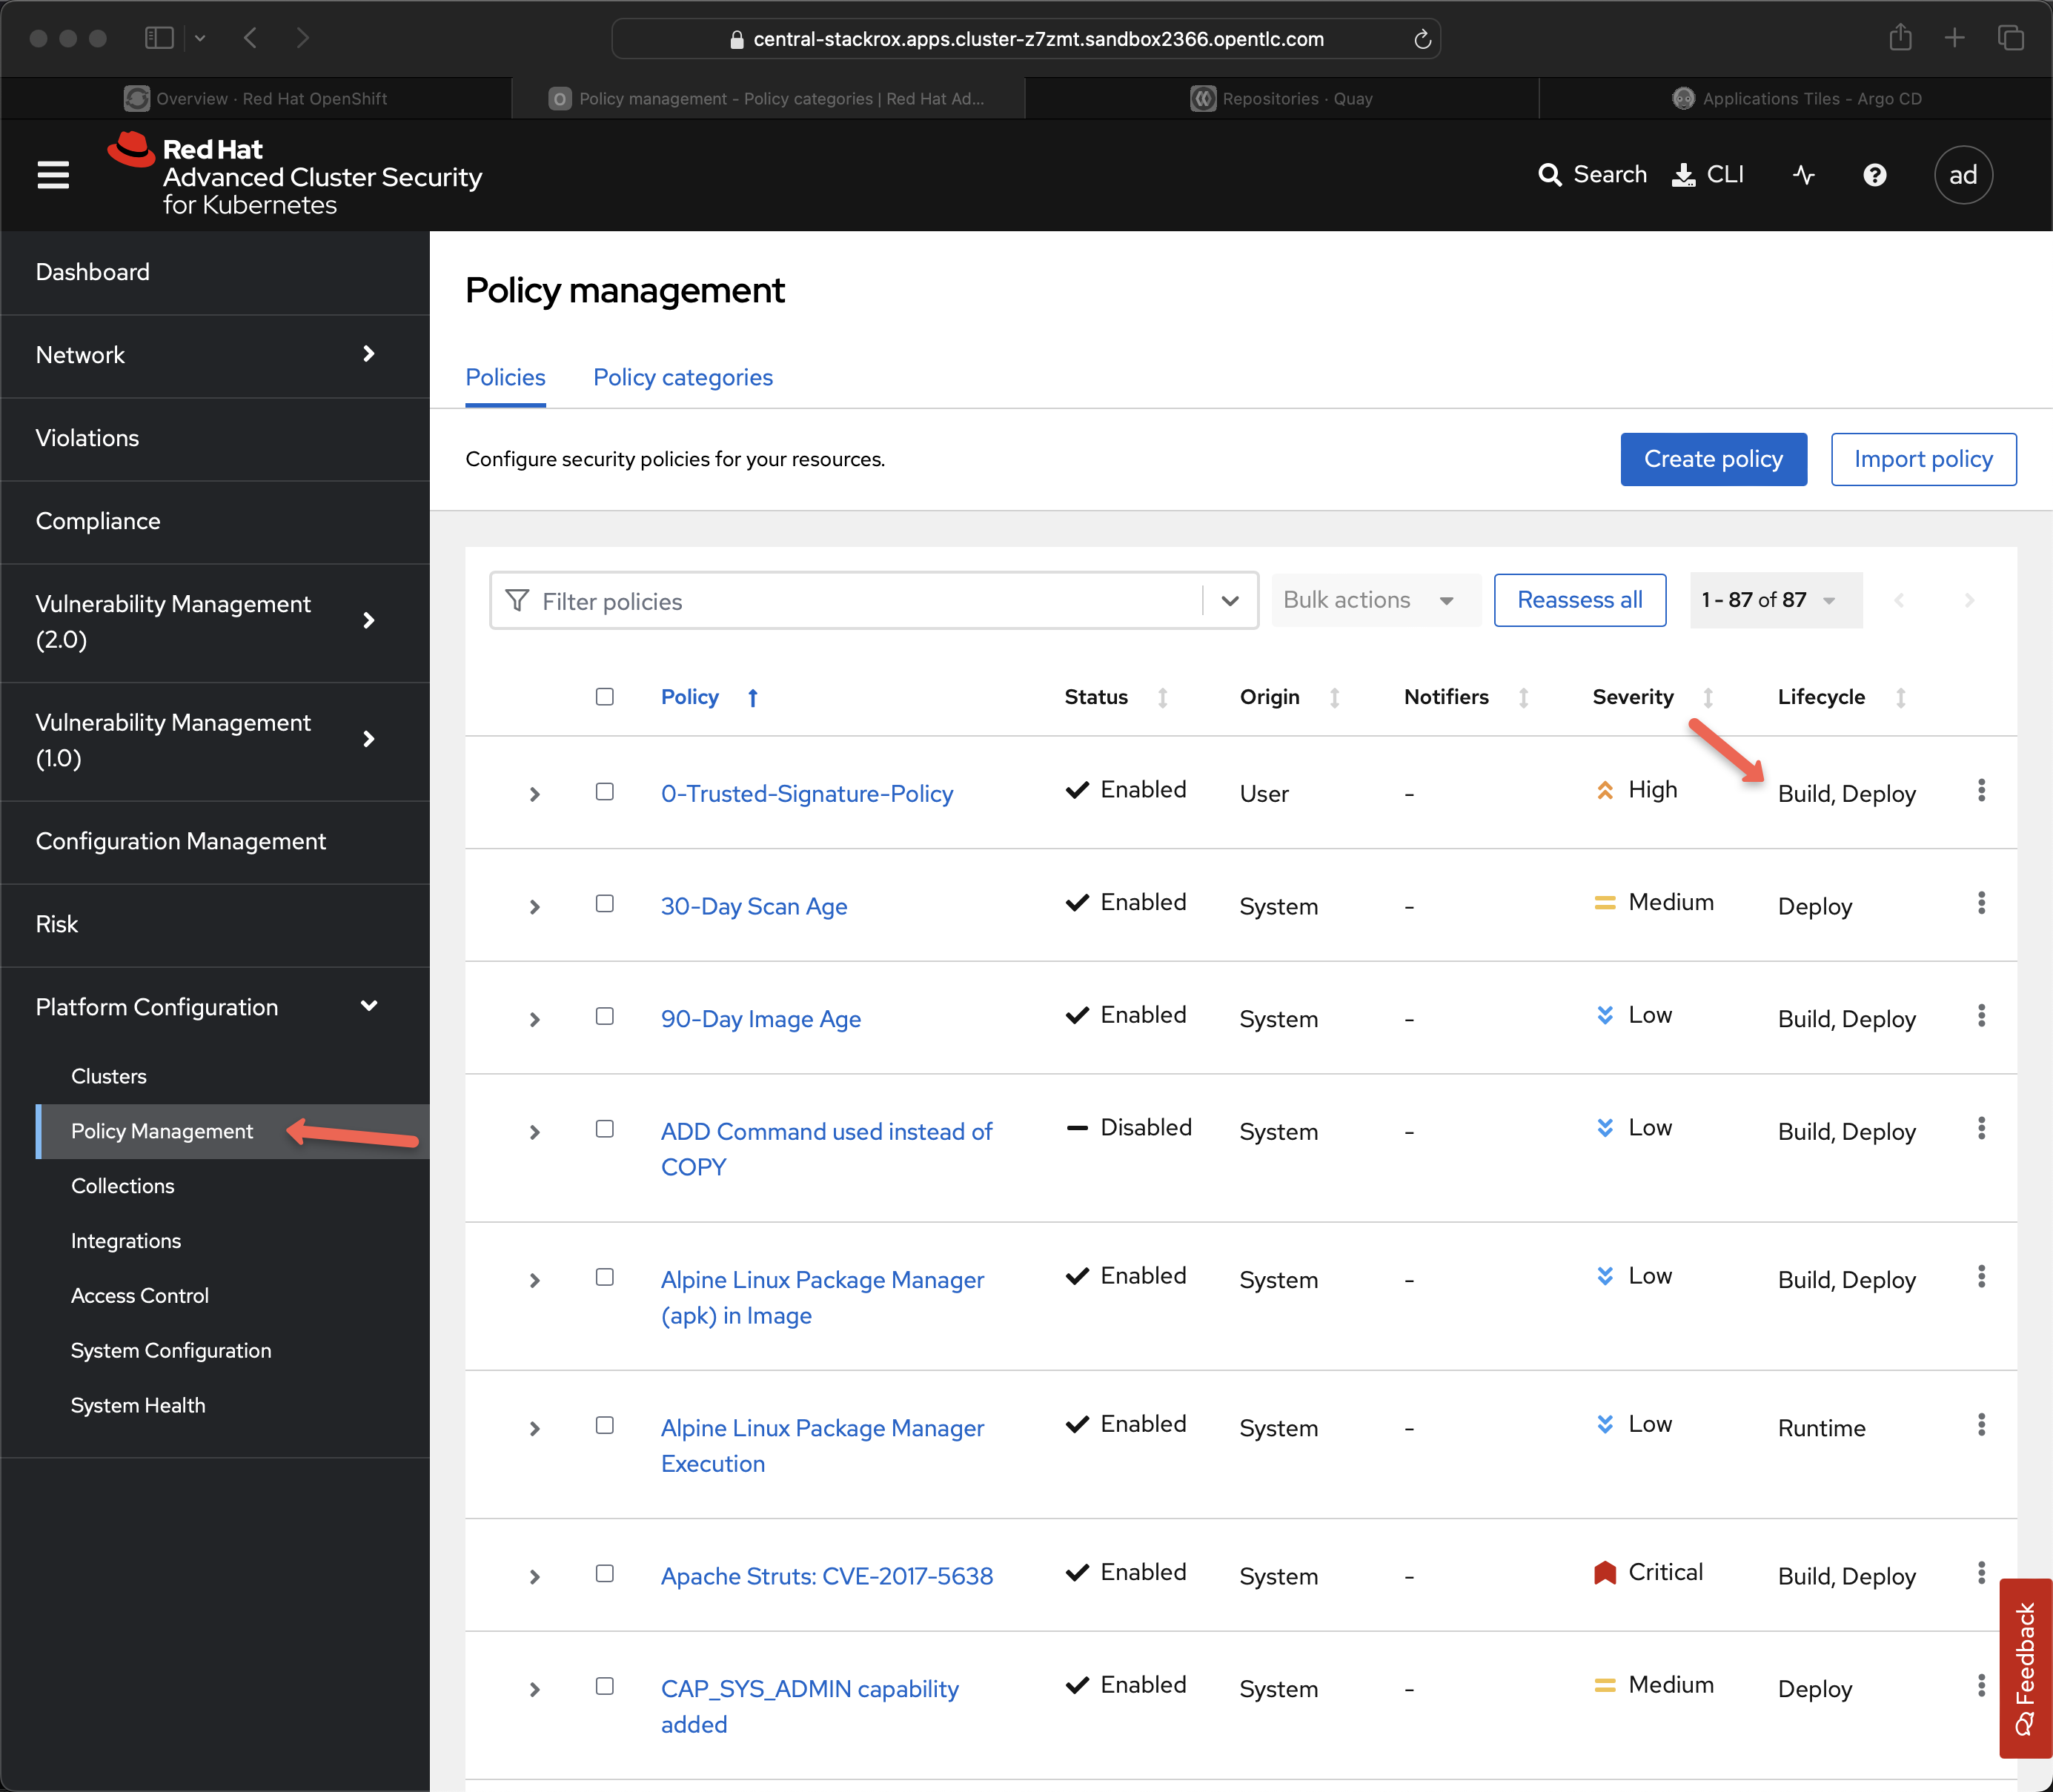
These ACS polices can be seen on the following screen, just look for Build policies under lifecycle.
These 3 aspects of roxctl are a great example of the "shift-left" idea by bringing these critical checks into the pipeline itself to be executed on each git push.
scan-export-sbom
Pushes the SBOM to a CycloneDX repository. Currently, the SBOM is stored in Quay and is not in an easily accessible or readable format. Pushing the SBOM to an additional repository allows us to access the raw JSON/XML file for further use outside of the CI process.
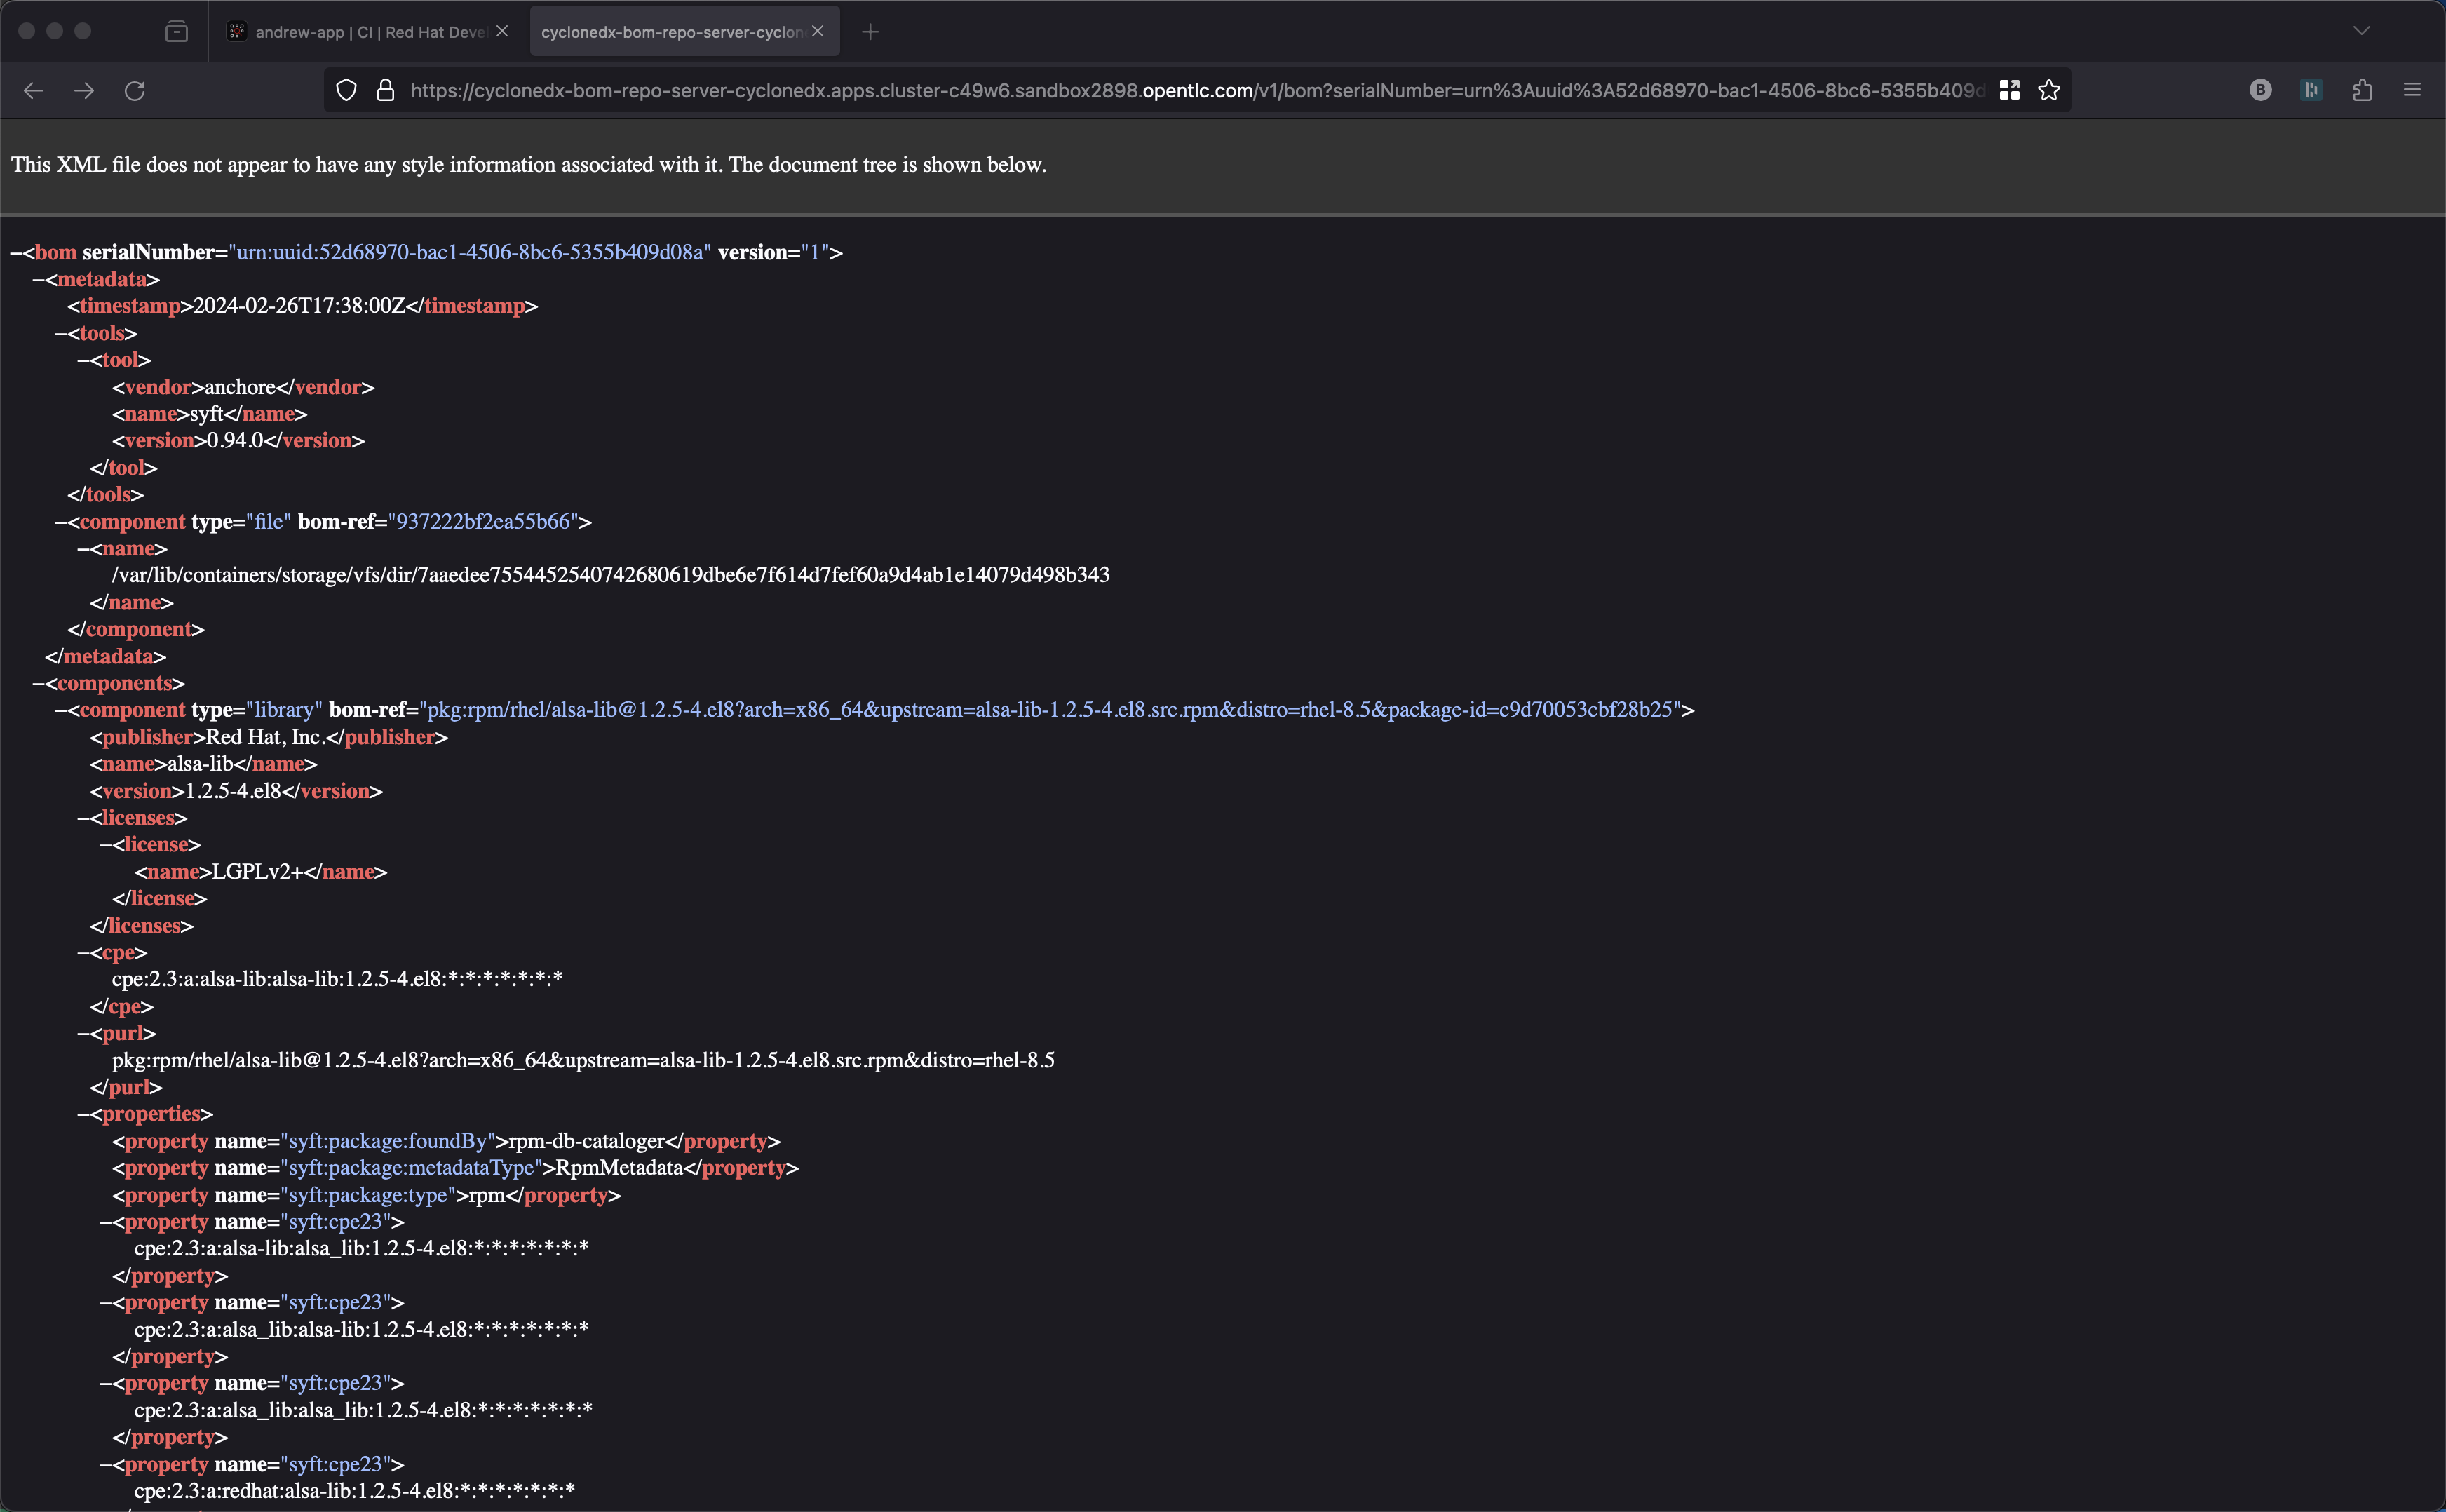
The SBOM is an artifact that deserves special mention. Think of the Software Bill of Materials as the ingredient list. I am sure you have gone to the grocery store and picked up an item and reviewed its packaging. On the back of the product there will be a list of ingredients. You can find out that something you might wish to eat includes gluten, perhaps too much sugar, or shellfish (my sister is allergic to shellfish) or perhaps nuts. Well, if you are allergic to nuts you might also be allergic to struts :-) You might remember that infamous Struts 2 vulnerability that allowed 143 million American’s private data to end up on the dark web Struts 2 hack.
The SBOM is either a JSON or XML file and is stored in the container registry as the ingredient list associated with the container image.
Dev Deployment
Click on Topology
As a developer, I want to see my handy work, did my applicatio really deploy to the dev environment?
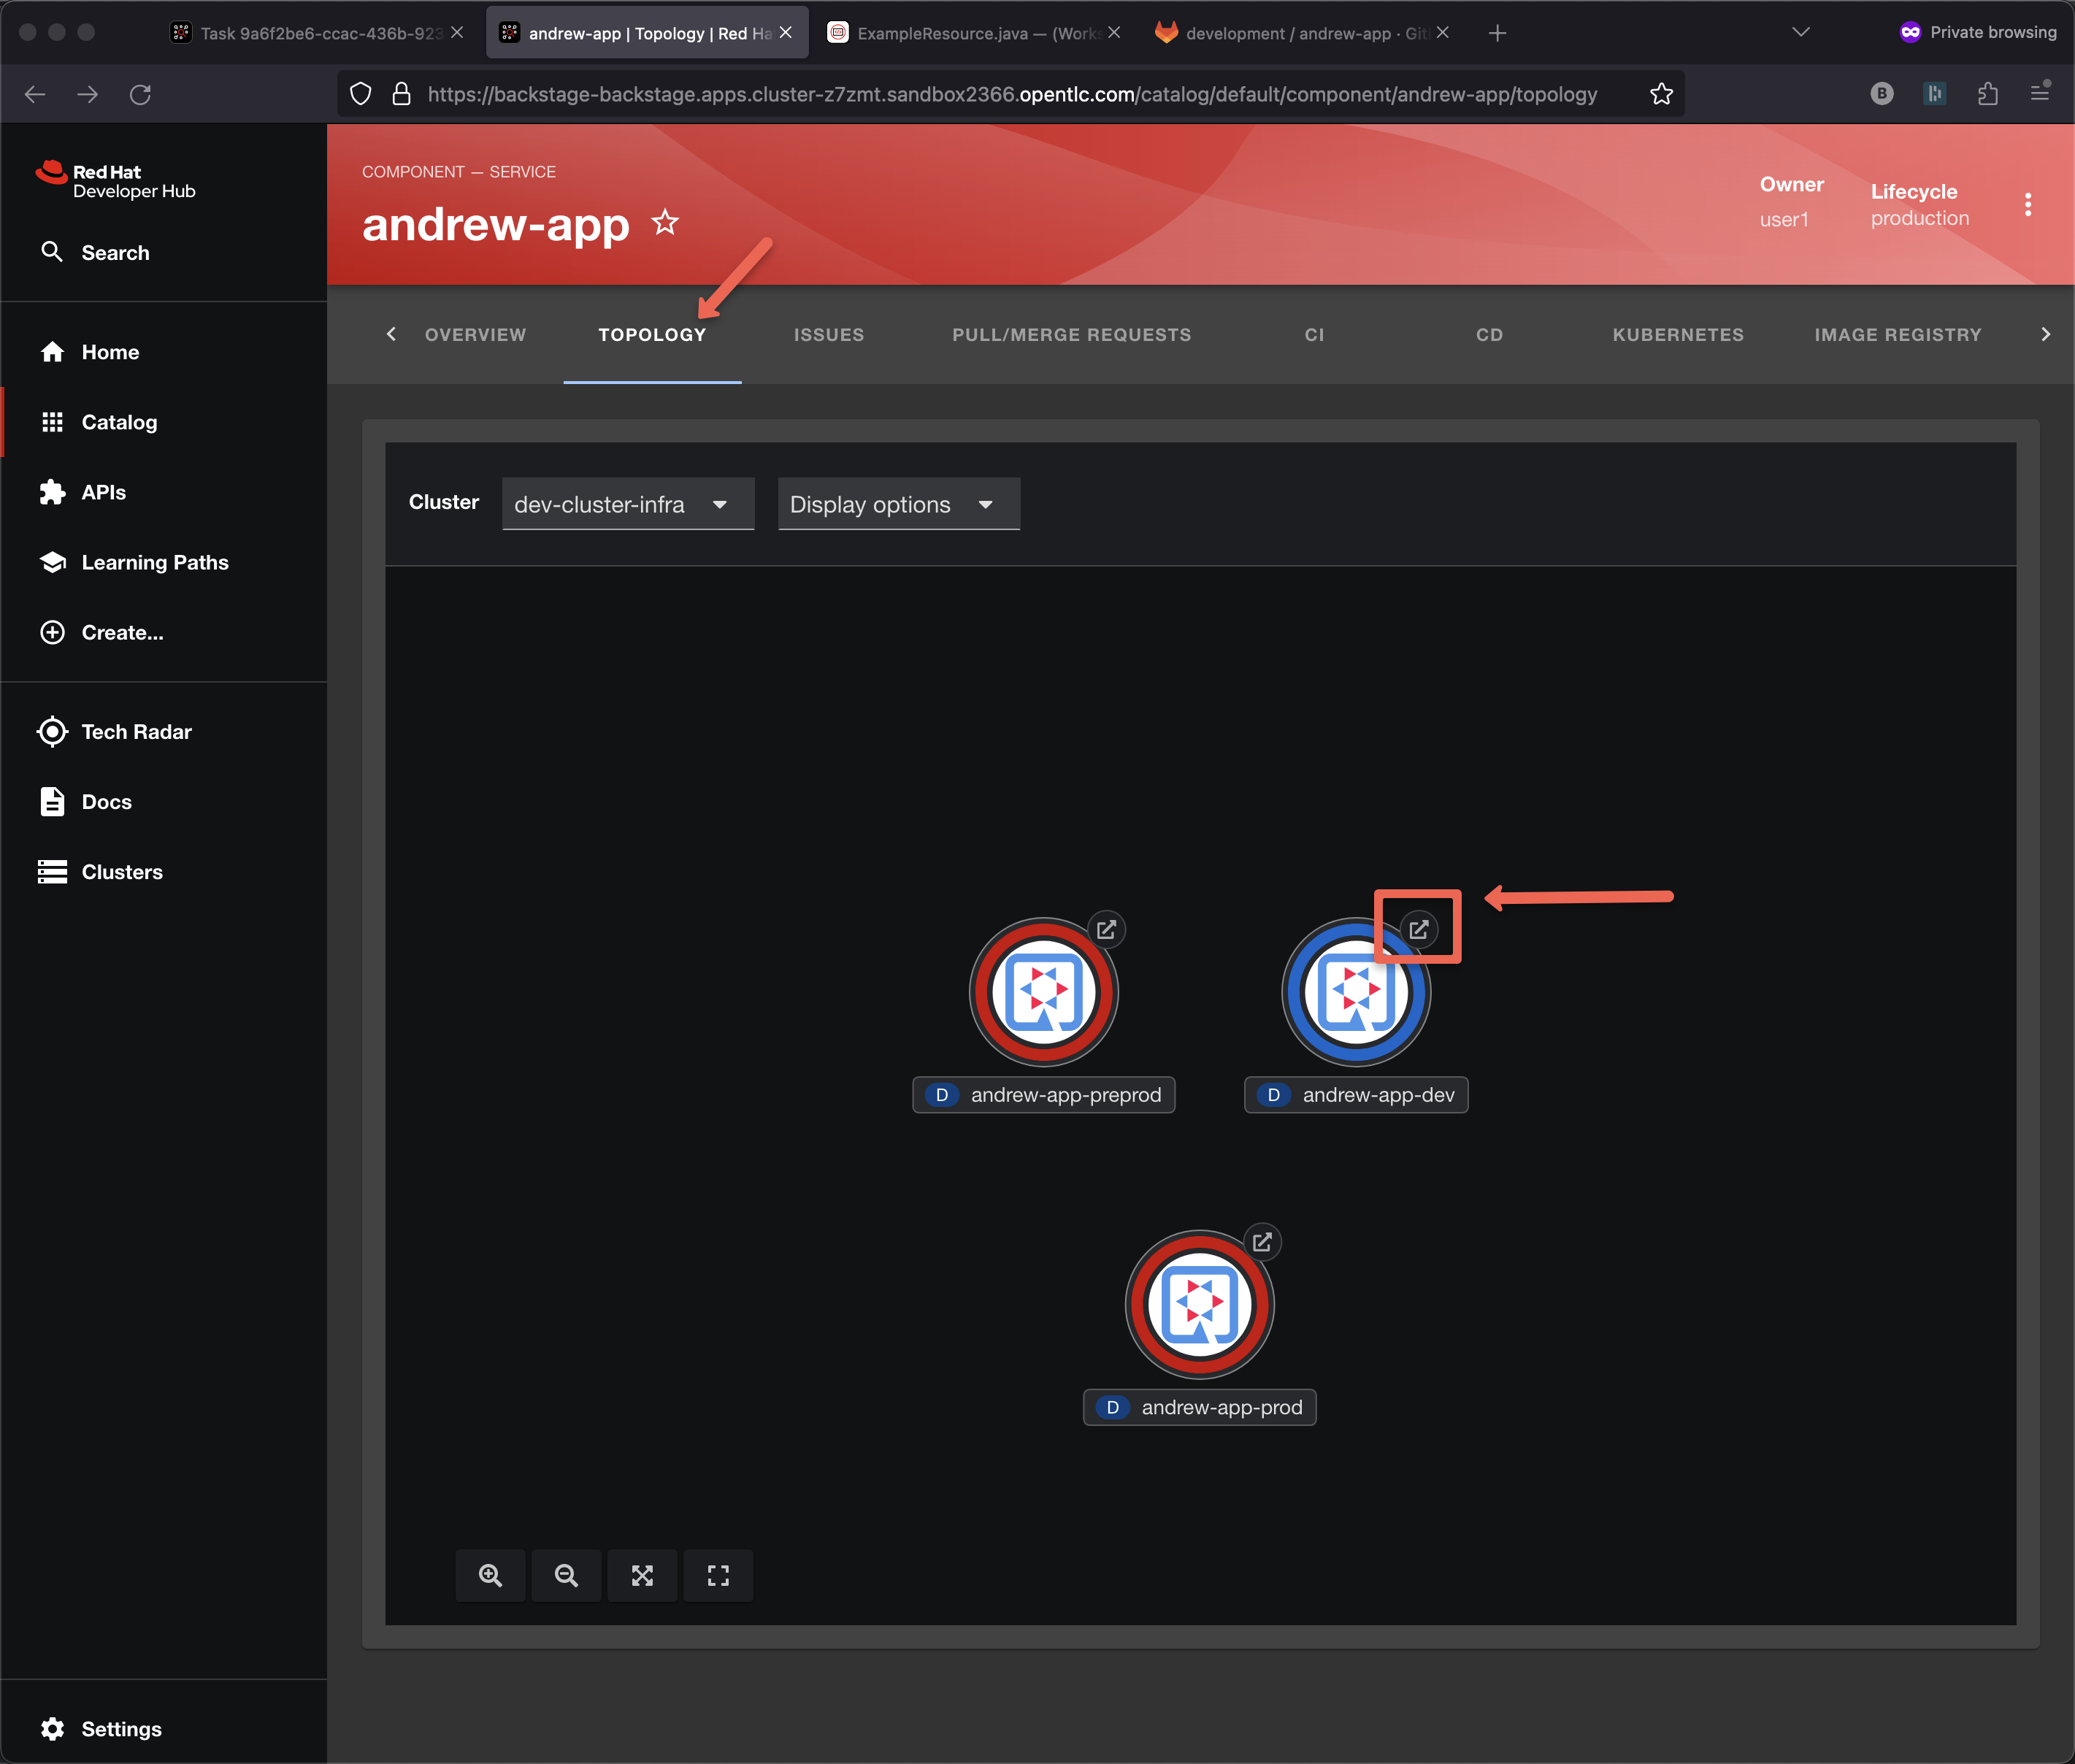
Note: pre-prod and prod have NOT yet deployed
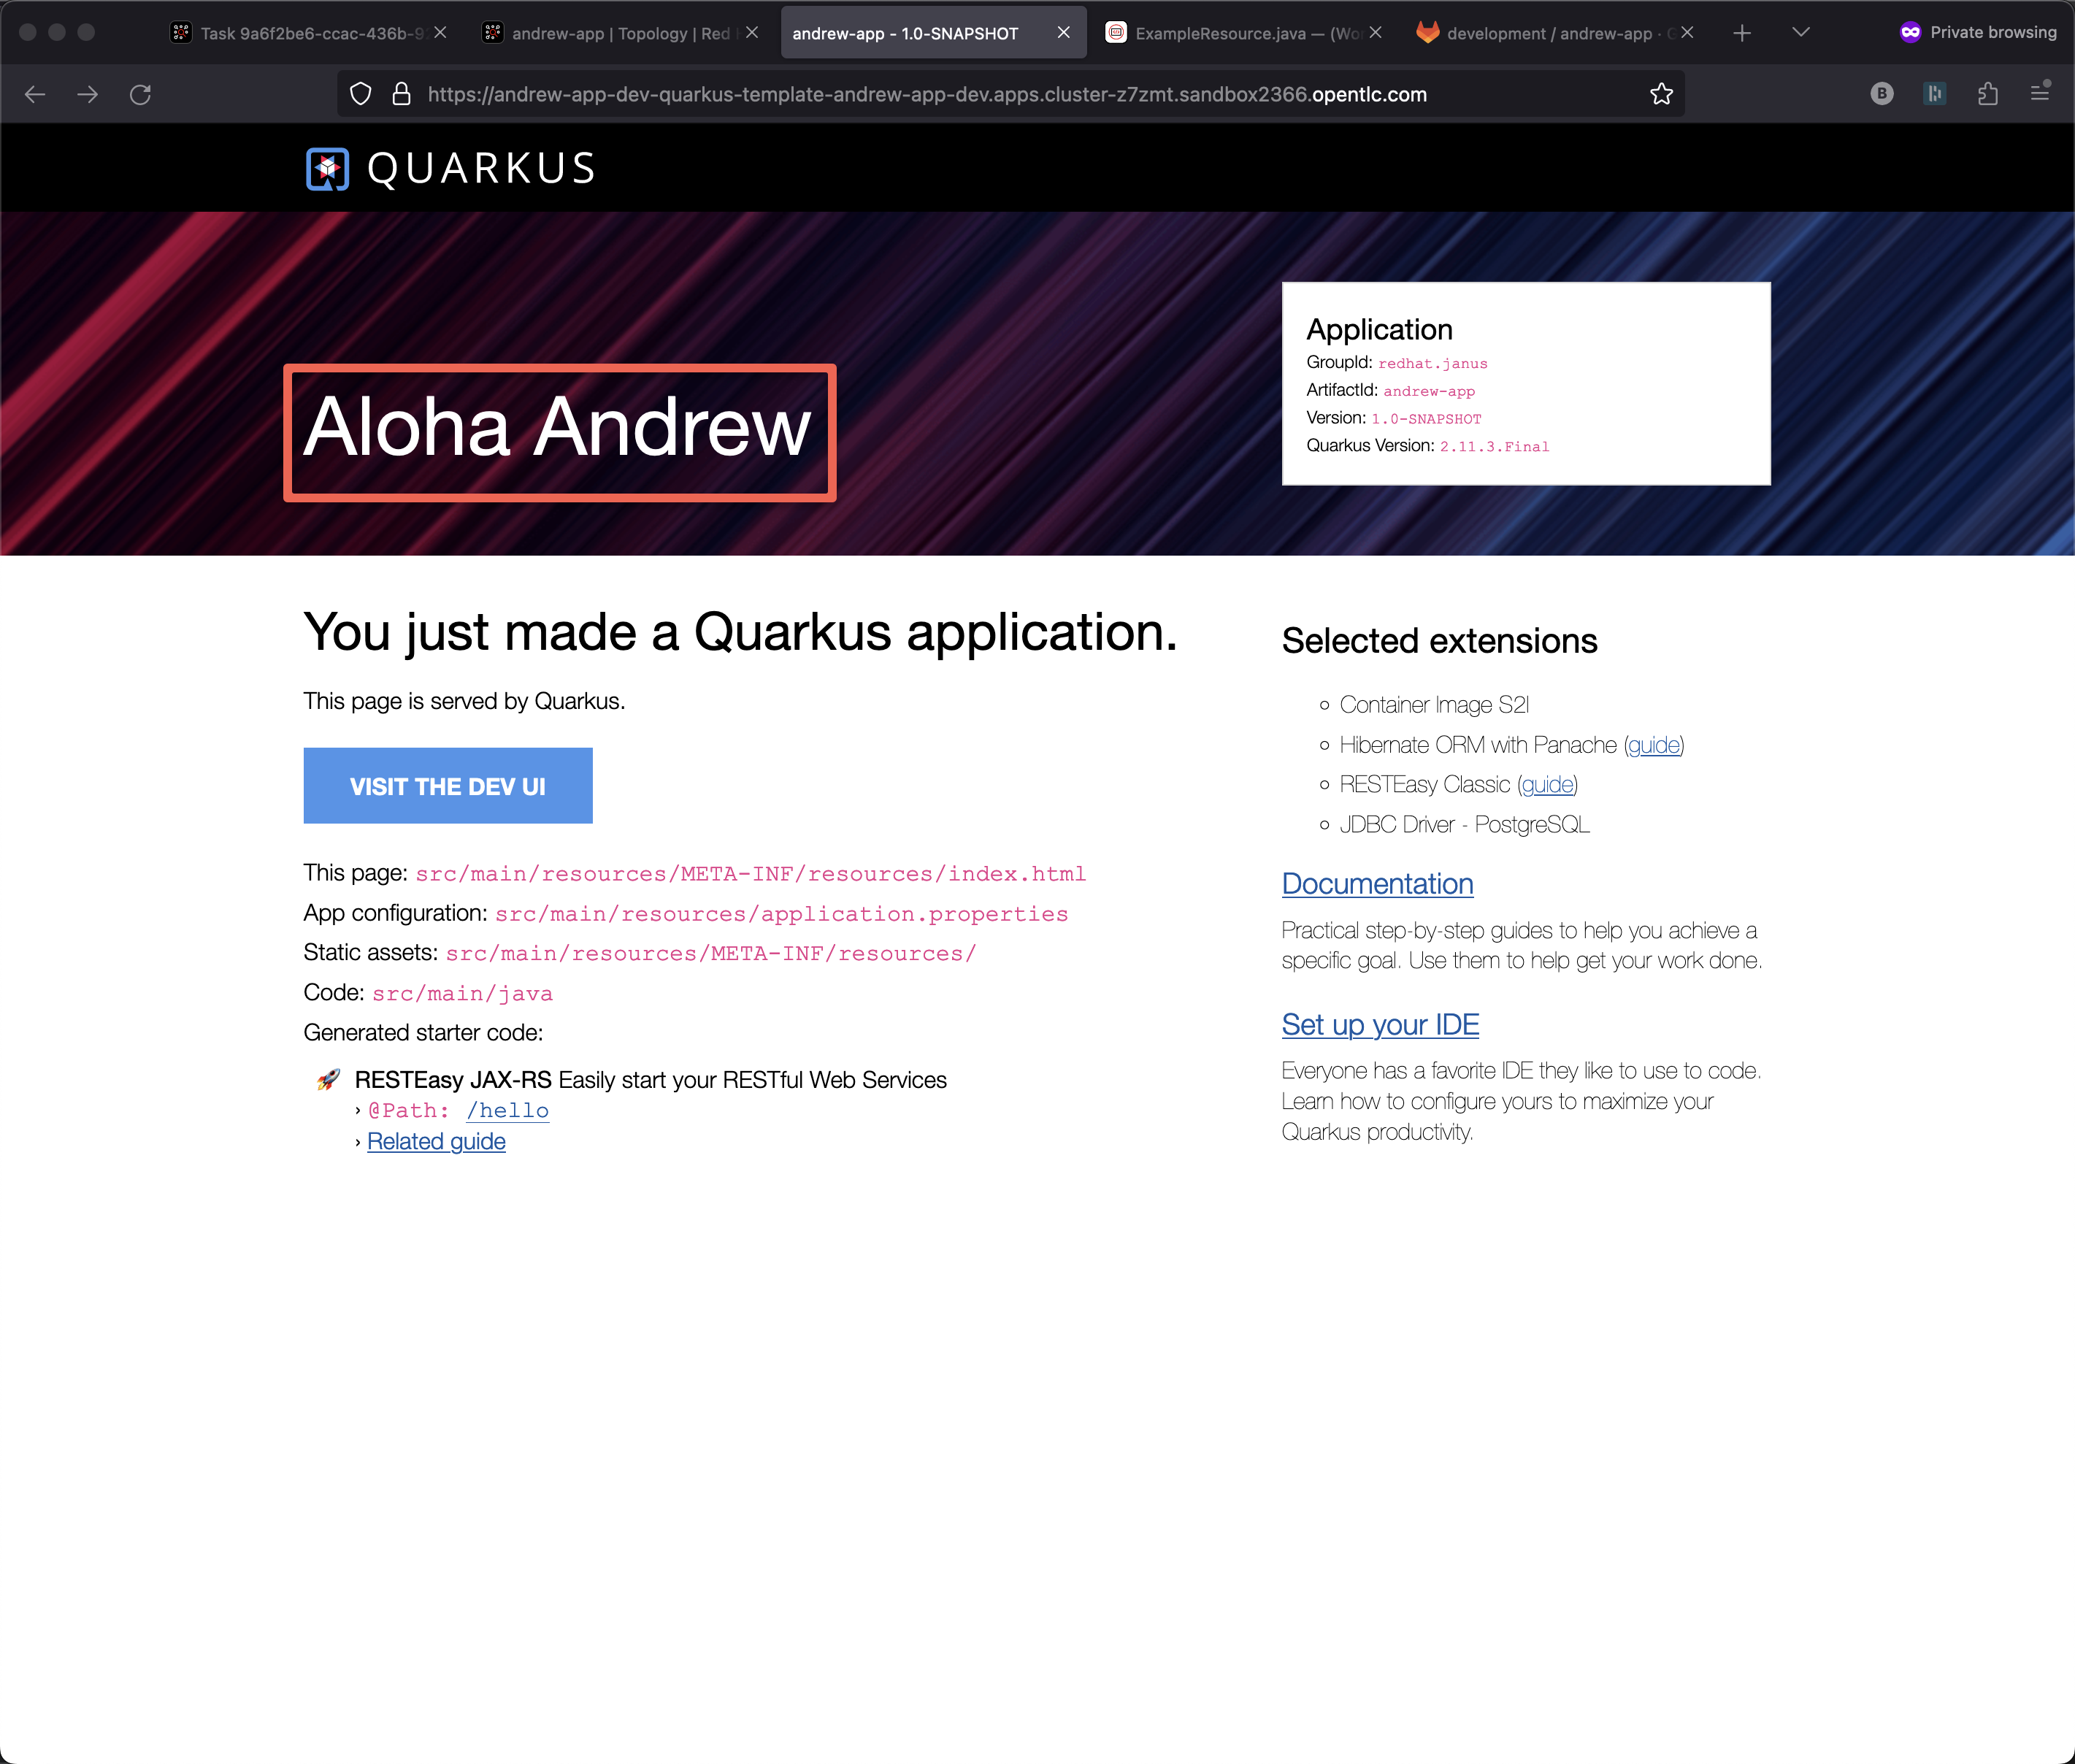
I can also explore the API inside the portal
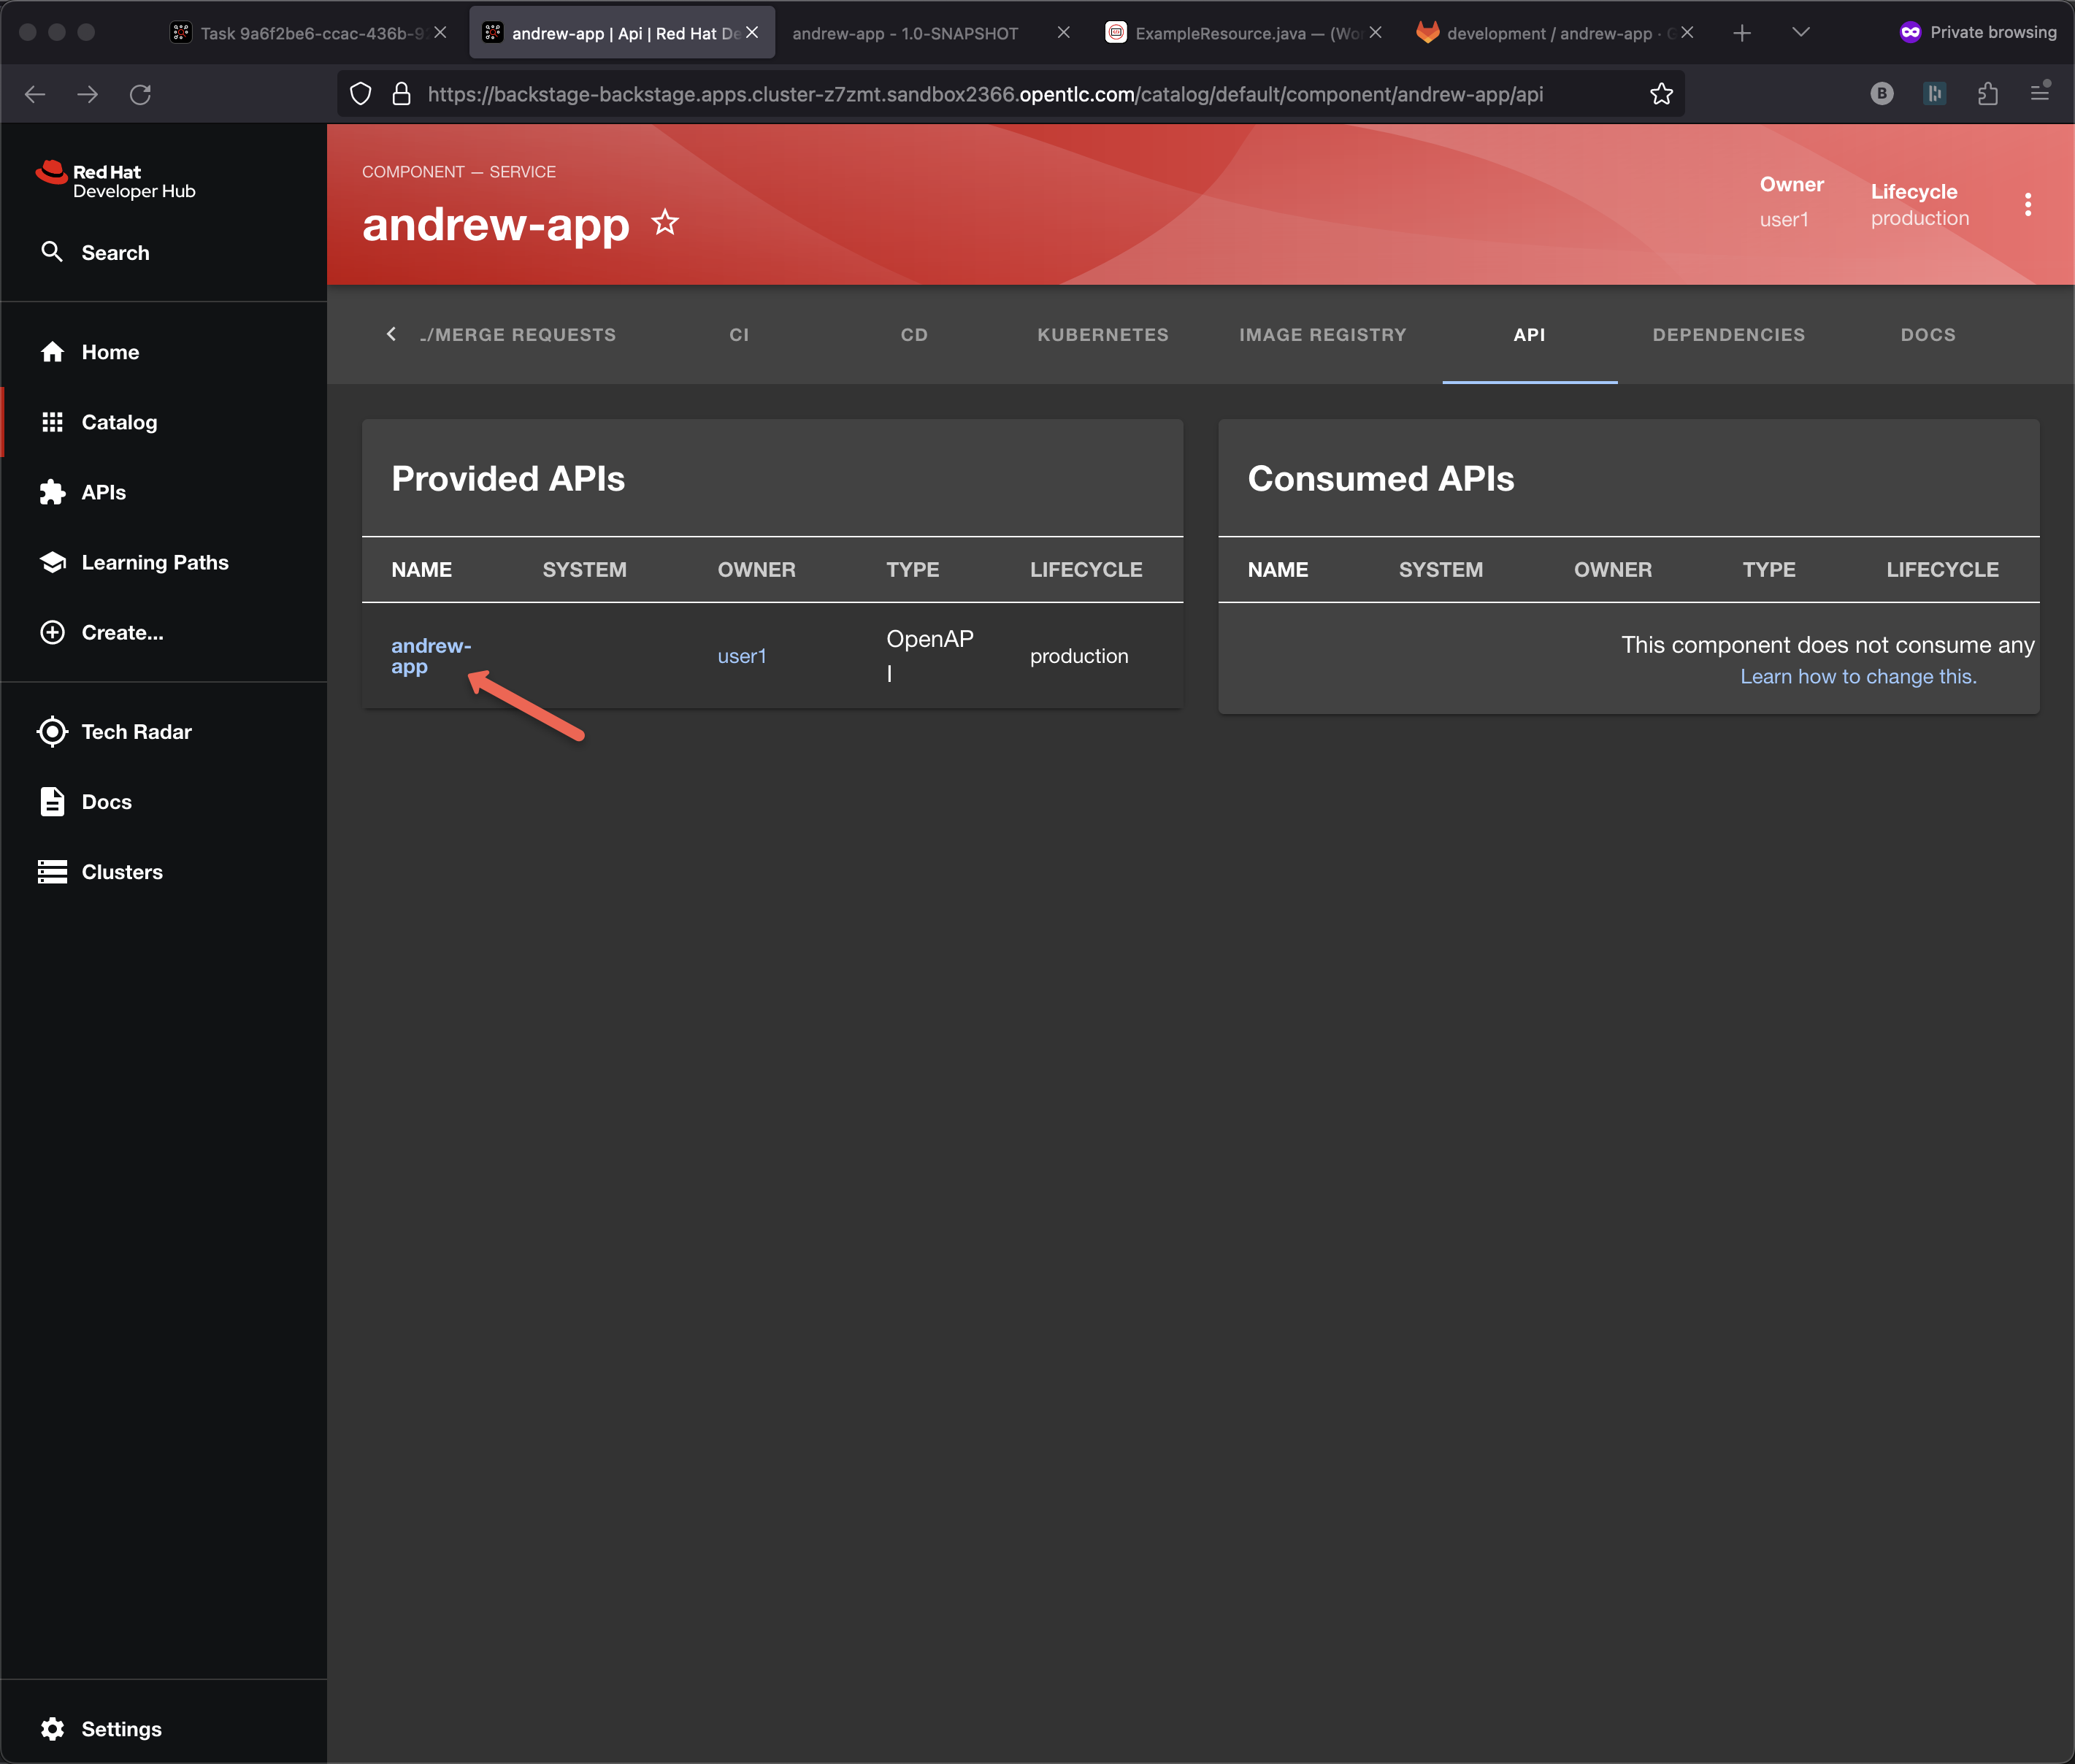
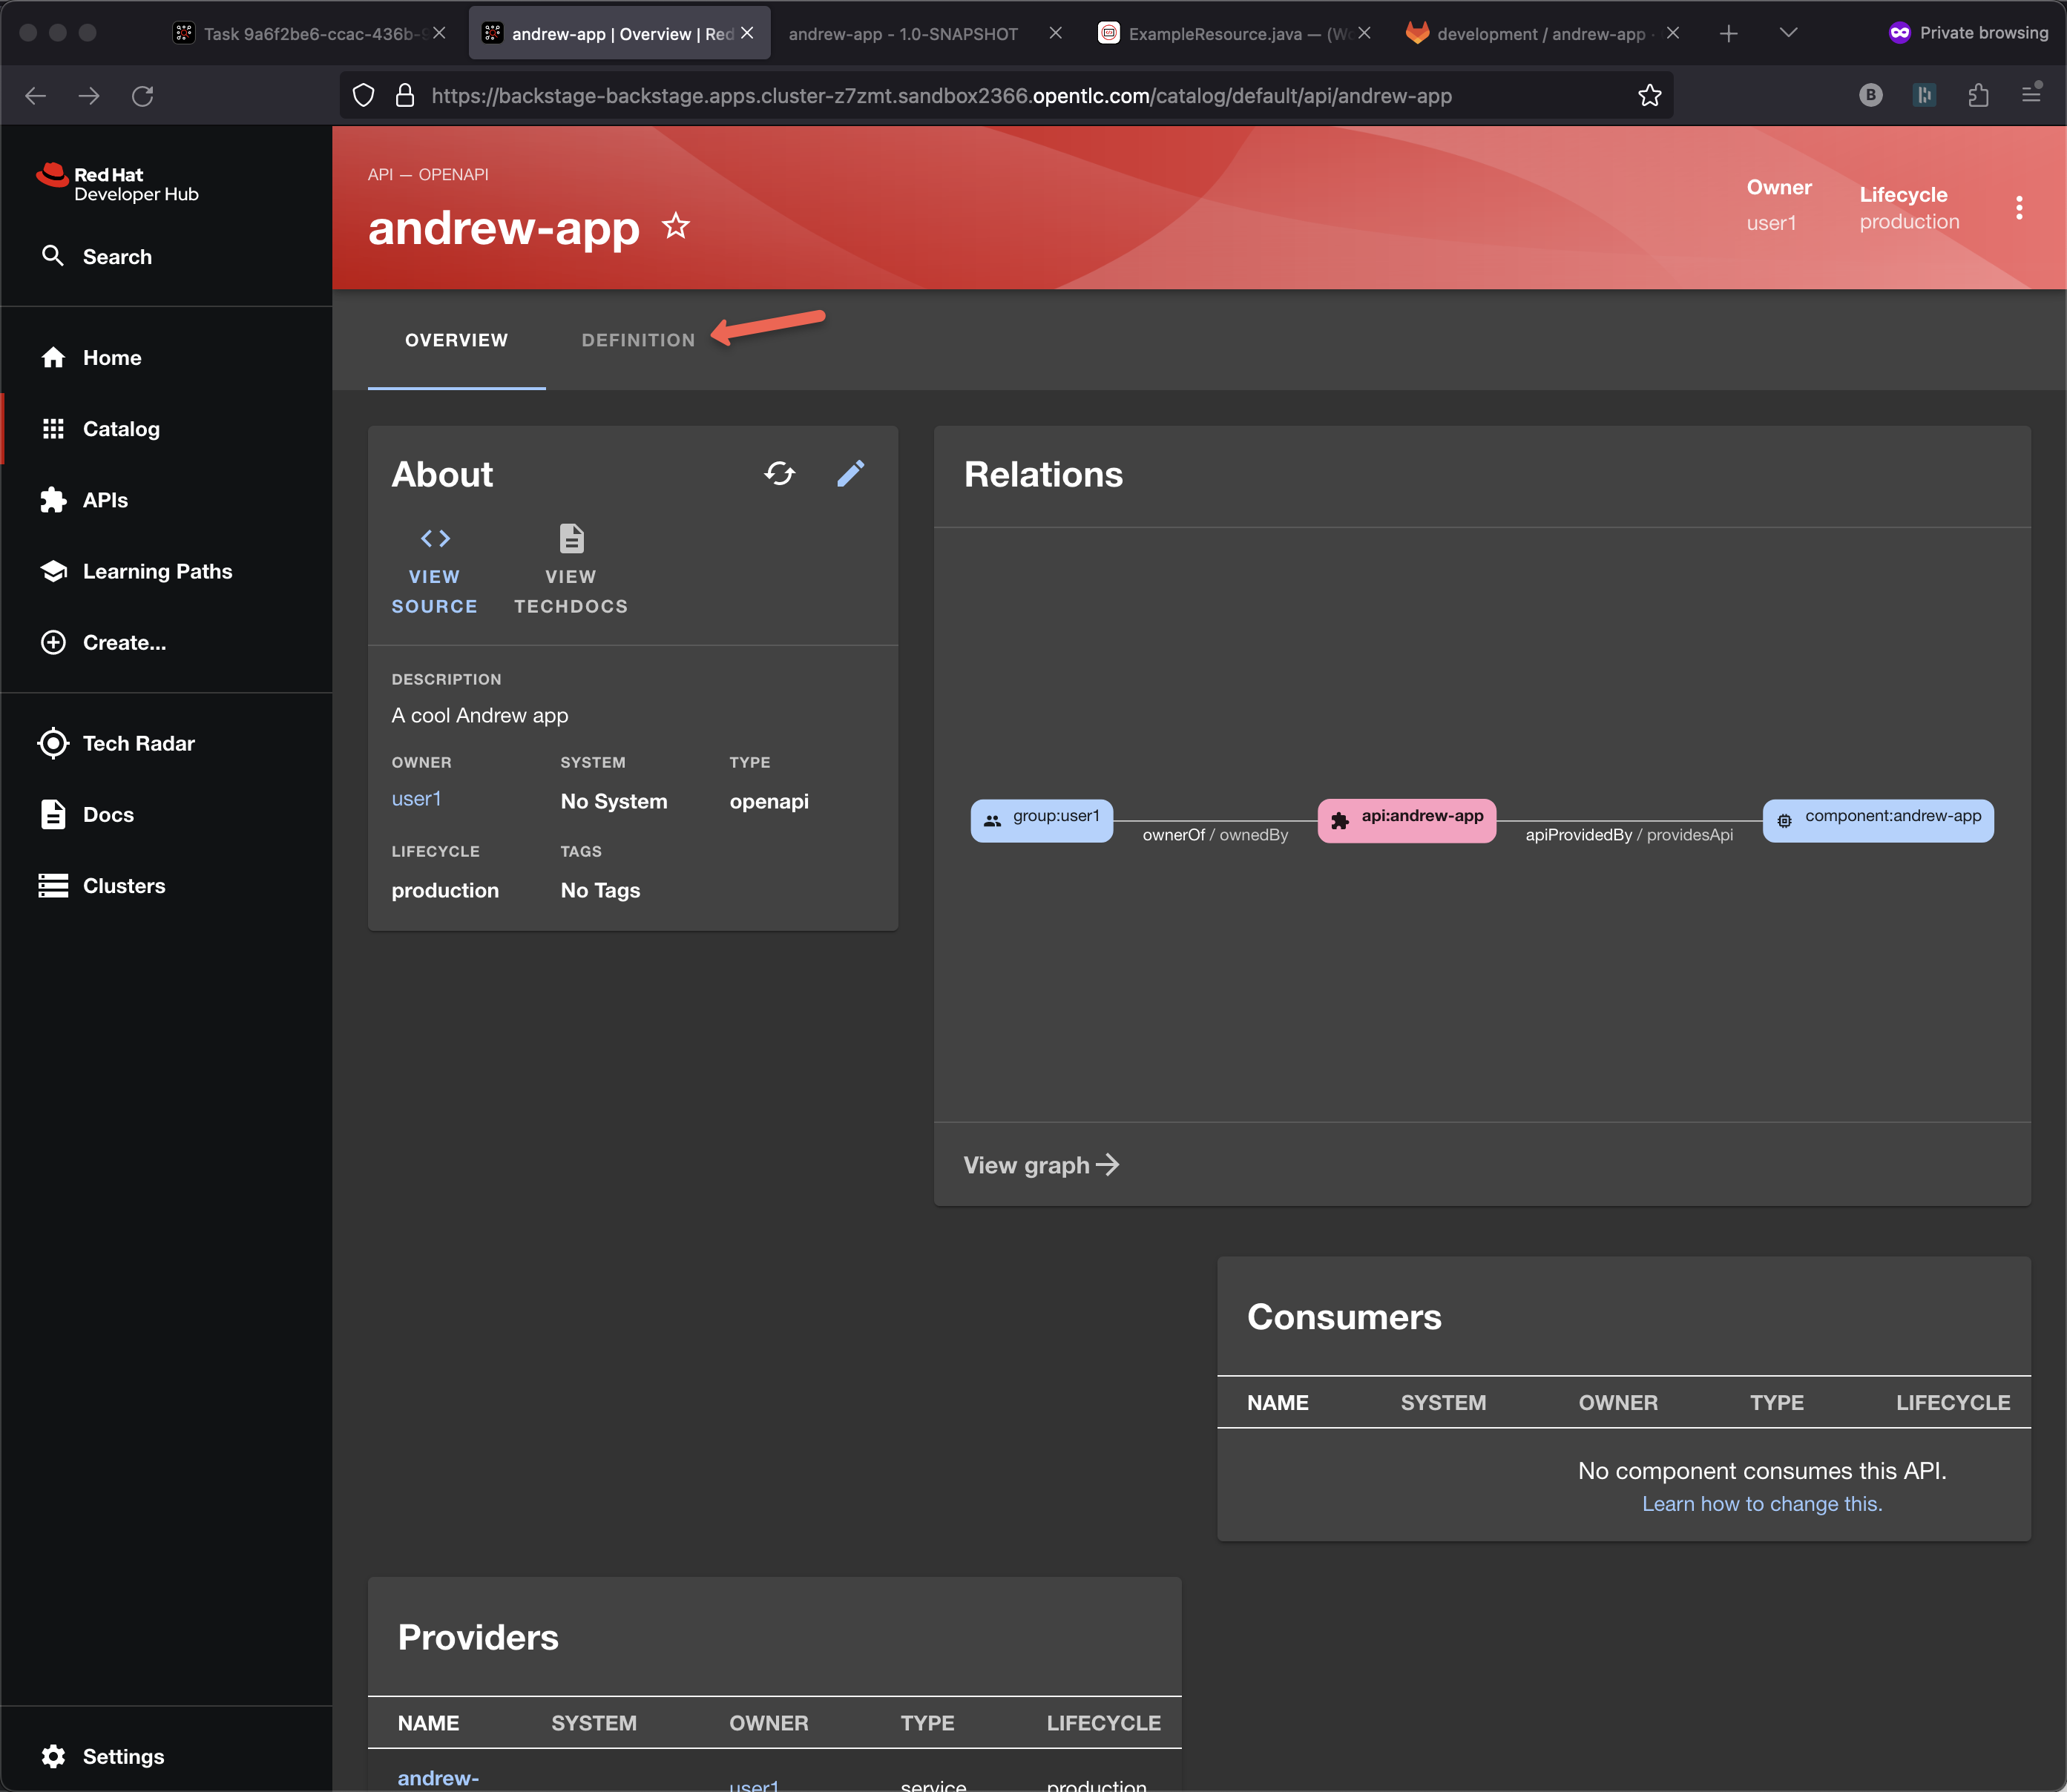
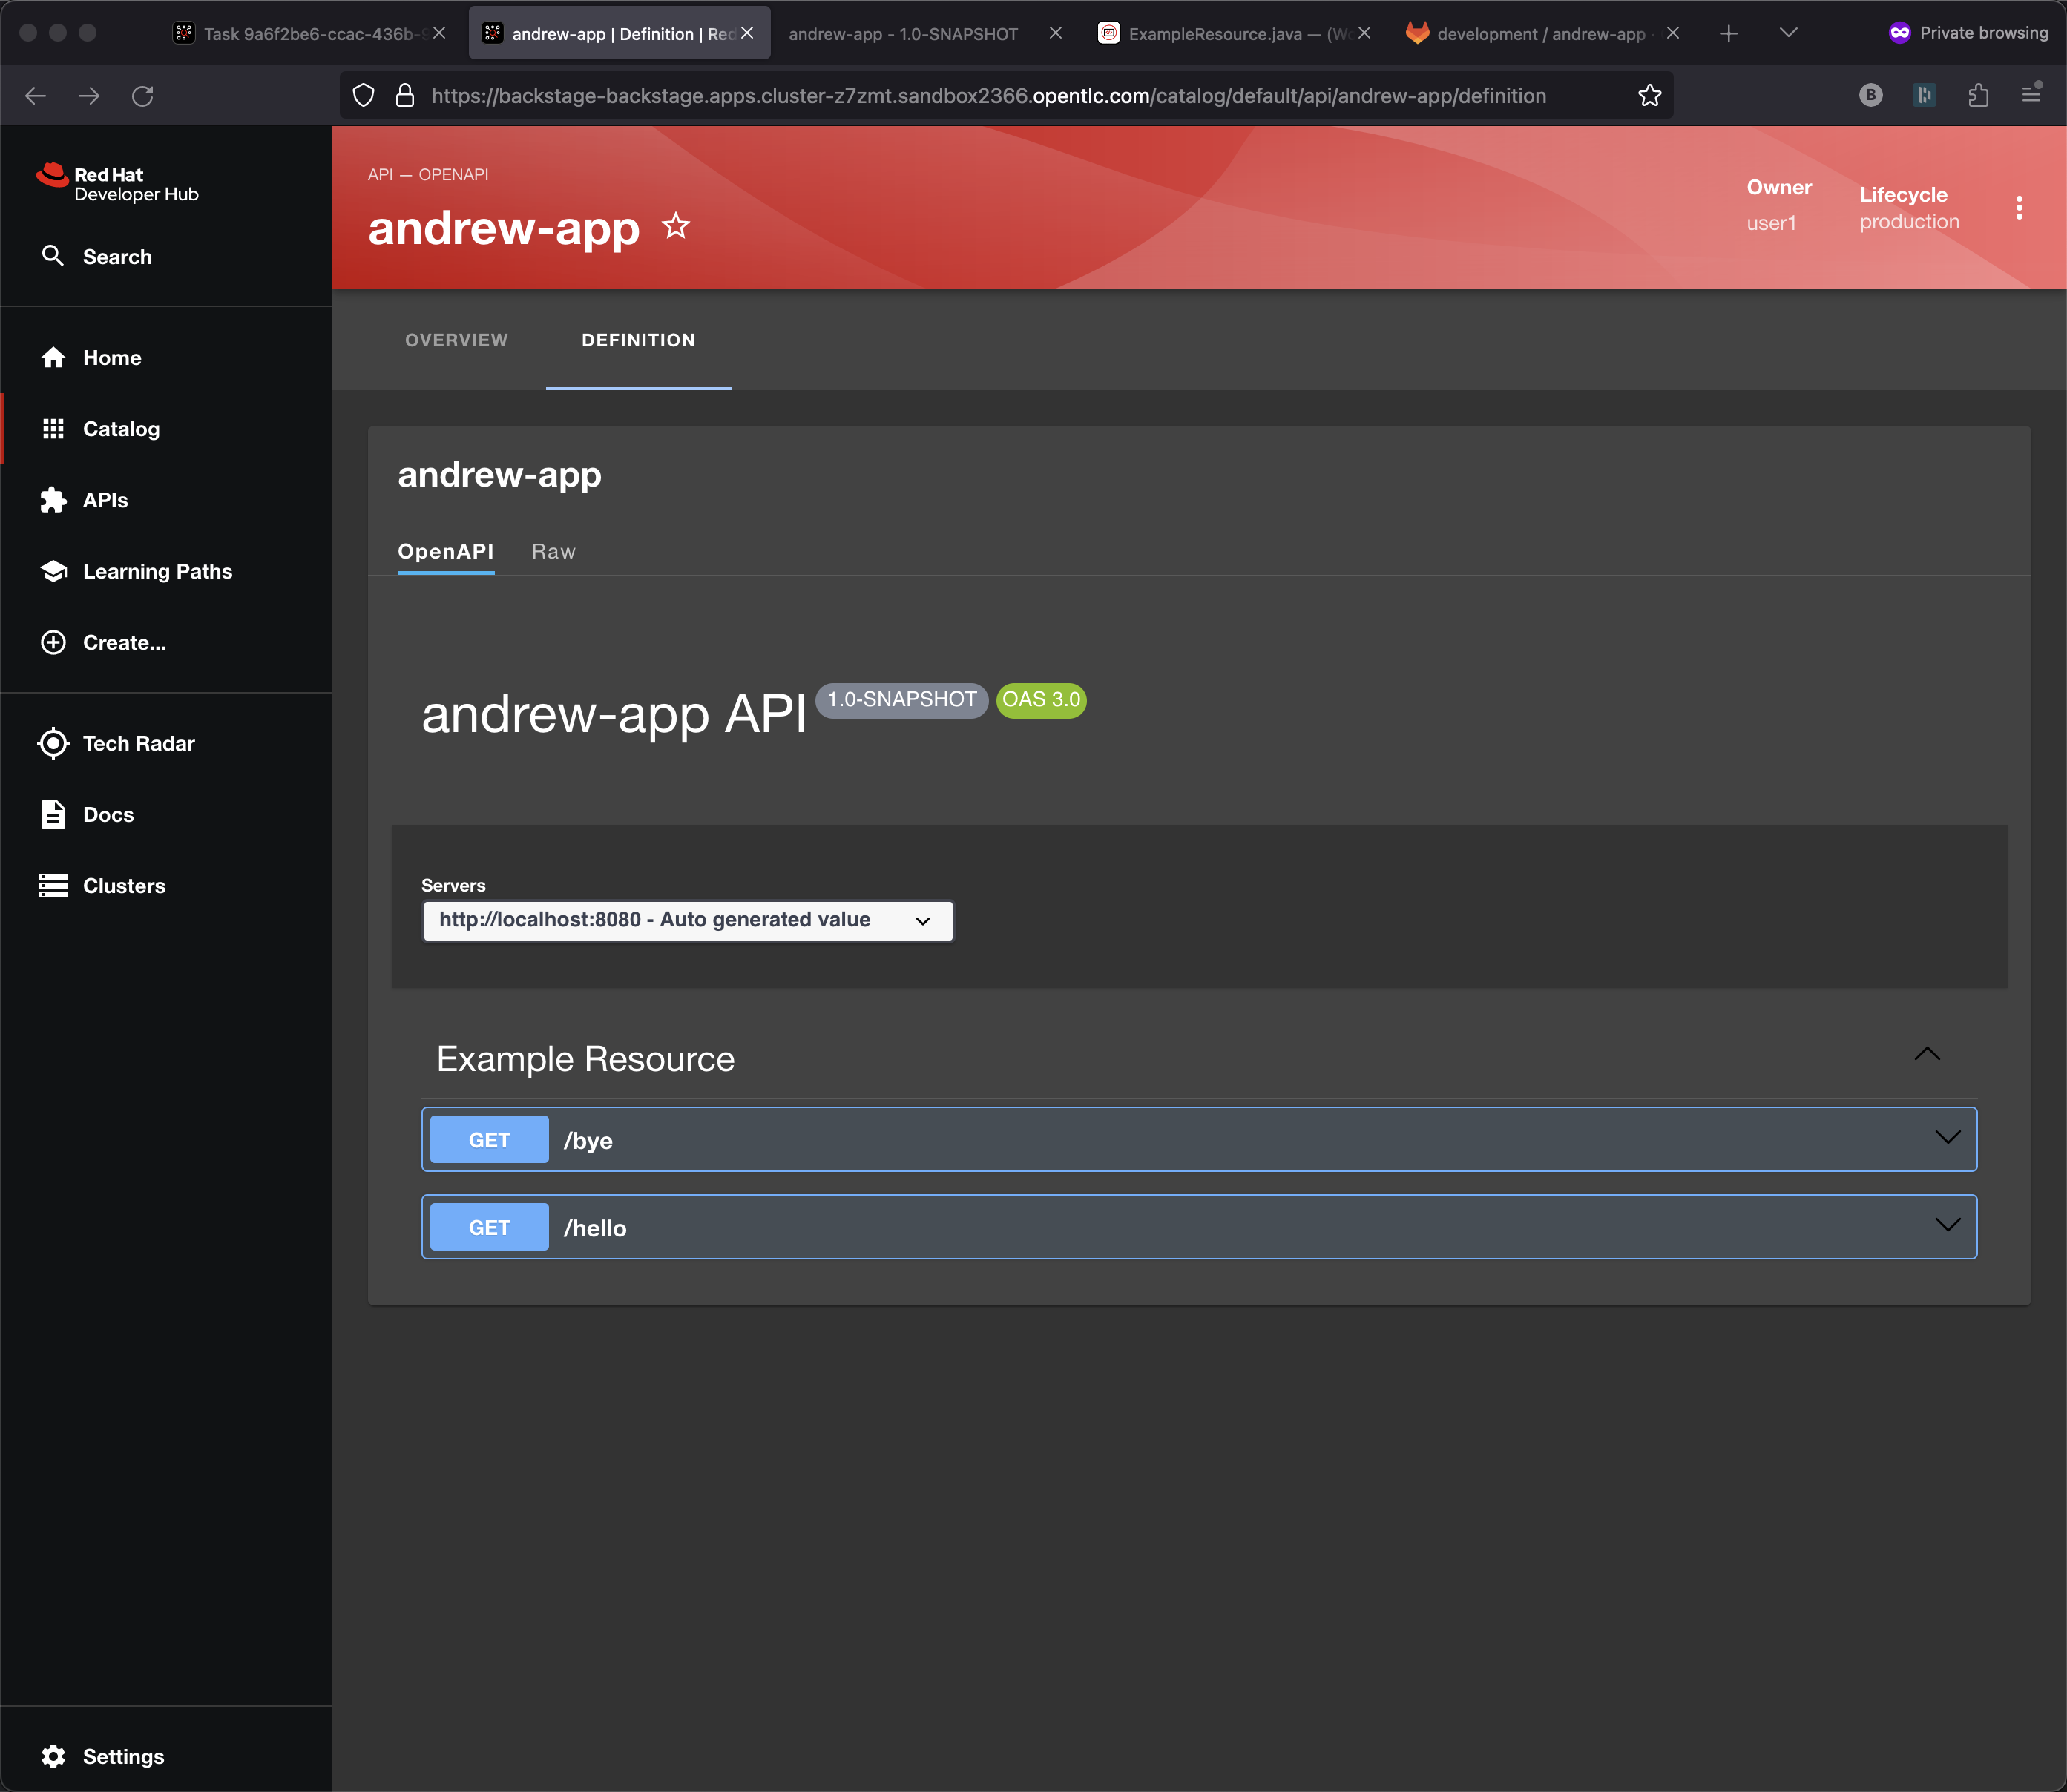
Note: This UX is depends on the openapi.yaml being updated correctly. If you are using quarkus:dev while editing the code them it gets updated automatically as ExampleResource.java is updated.